Figure 1.
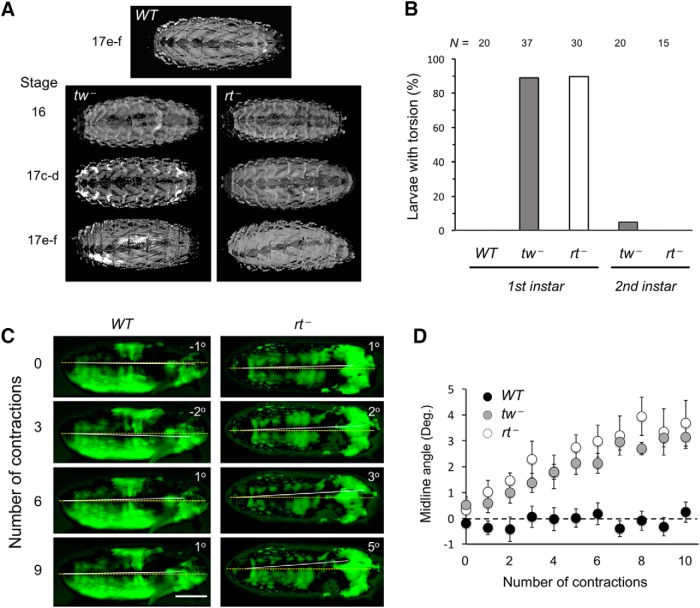
Body torsion phenotype of POMT mutant embryos. A, POMT mutants show body torsion phenotype. Top, Wild-type embryos have no torsion at any stage (stage 17e–f is shown). Bottom, tw and rt mutants show no torsion at stage 16 and usually no torsion at stages 17a–d. By stages 17e–f, nearly 100% of mutant embryos show left-handed torsion. B, The torsion phenotype is highly penetrant in first instar larvae but essentially disappears in the second instar stage. N, number of larvae analyzed for each stage. C, Representative images displaying changes in dorsal midline (white line) angle over several contractions. Dashed yellow line represents the AP axis. Positive and negative angles between yellow and white lines represent left-handed and right-handed torsion, respectively. In A and C, anterior is to the right. D, Average angle between dorsal midline and the AP axis over the first 10 contractions. Ten embryos were analyzed for WT and tw−, and 5 embryos were analyzed for rt−. Scale bars, 100 μm.WT, wild-type. rt−, rtP/rtP. tw−, tw1/ tw1(or tw1/Y). All genotypes also included a transgenic MHC-GFP construct to visualize muscles. Statistical analyses: error bars show SEM; starting at contraction 5, the difference between WT and either mutant genotype is statistically significant (ANOVA with a Tukey-HSD post hoc test: largest p values are 0.02, 0.02, 6E-5, 6E-5, 1E-3, and 1E-4 for contractions 5–10, respectively).

