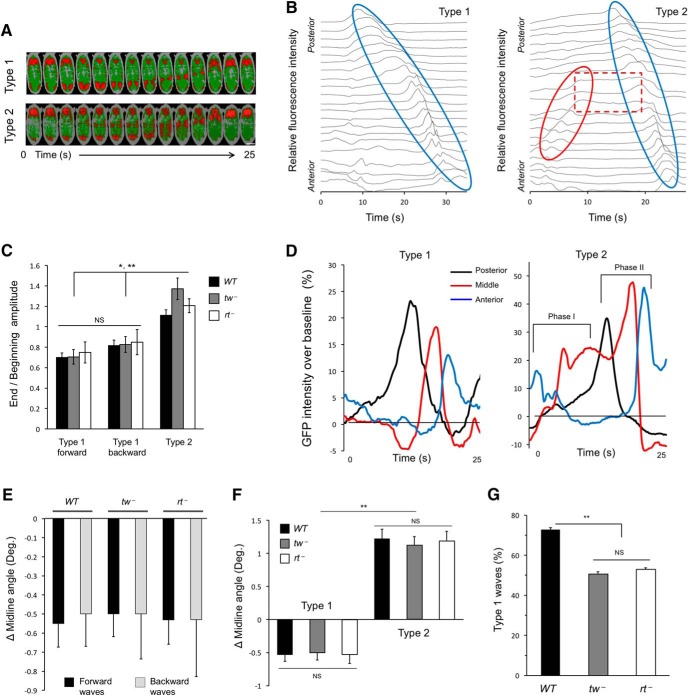
Figure 3.
Body torsion phenotype of POMT mutants is associated with an abnormal pattern of contraction waves. A, False-color images of type 1 and type 2 contractions in embryos expressing MHC-GFP (red pixels indicate higher signal). Scale bar, 100 μm. B, Profile examples of type 1 and type 2 waves. Contraction amplitude along embryo body is plotted over a period of one wave. Blue ovals indicate progression of contractions from posterior to anterior. Red oval indicates progression of type 2 wave from anterior to posterior during its first phase. Dashed red box indicates static contraction at the end of the first phase. Blue oval in type 2 wave corresponds to the second phase of the wave. C, Ratio between amplitudes of contraction in the end and the beginning of a wave calculated for type 1 forward and backward waves, and for the second phase of type 2 waves. D, Representative examples of contraction amplitude distribution along the embryo in type 1 forward wave (left) and type 2 wave (right). Contraction amplitude was measured for the same wave at posterior (A7, black line), middle (A4, red line), and anterior (T2, blue line) segments of the embryo. First and second phases of the type 2 wave are indicated. Contraction amplitude was analyzed using MHC-GFP. E, Type 1 contractions have a similar effect on dorsal midline angle and cause right-handed body torsion regardless of genotype and direction of propagation. There is no statistical difference between any groups of data displayed. F, Contractions of the same type yield statistically indistinguishable effects on torsion, regardless of genotype, while the effects of type 1 and type 2 waves within a given genotype are significantly different, being opposite in direction. G, POMT mutants generate smaller proportions of type 1 waves compared with wild-type embryos, though mutants are not significantly different from each other. Number of embryos and contractions analyzed: C, 10 embryos for WT, 8 embryos for each mutant, and at least 20 individual contractions of each type for each genotype. E, 10 embryos were analyzed for each WT and tw− genotypes, 8 embryos were analyzed for rt−, and at least 20 contractions of each type were analyzed for each embryo. F, 10 embryos for WT and tw, at least 40 contractions of each type for each genotype; 8 embryos and at least 30 contractions of each type for rt−. G, 10 embryos and >130 contractions for each genotype. WT, wild-type. rt−, rtP/rtP. tw−, tw1/ tw1 (or tw1/Y). In all panels, error bars indicate SEM. *p < 0.05, **p < 0.01. NS, Not significantly different. Statistical analyses: C, p > 0.9 for differences among data for type 1 waves, p > 0.7 for type 2 waves, all genotypes; p values for comparison between type 1 and type 2 waves for WT, tw−, and rt−: 0.03, 0.007, and 0.008, respectively. E, p > 0.9. F, p > 0.9 for differences among data for type 1 or type 2 waves, all genotypes; p < 1E-5 for comparison between type 1 and type 2 waves. G, p < 3E-5 for differences between WT and tw− or rt−; p = 0.86 for tw− vs rt− comparison.

