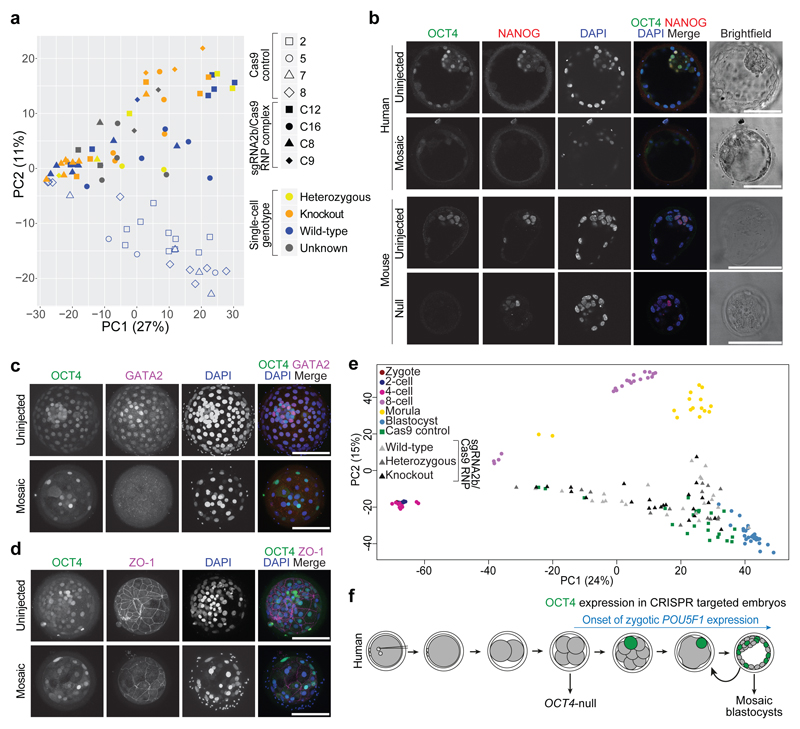
Figure 4. Phenotypic characterization of OCT4-targeted human embryos.
a, Principal component analysis of single-cell RNA-seq data showing comparisons between the cells from human blastocysts that developed following microinjection of the sgRNA2b–Cas9 ribonucleoprotein complex (filled shapes) and Cas9-microinjected controls (unfilled shapes). The genotype of each cell is distinguished by colour. Five samples failed repeated genotyping but the RNA quality is good and these are listed as Unknown. Each data point represents a single cell. b, Immunofluorescence analysis for OCT4 (green), NANOG (red) and DAPI nuclear staining (blue) in a human or a mouse uninjected control blastocyst or blastocyst that developed after sgRNA2b–Cas9 microinjection (mouse: n = 7; human: n = 3). Confocal z-section. Scale bar, 100 μm. c, Immunofluorescence analysis for OCT4 (green), GATA2 (magenta) and DAPI nuclear staining (blue) in an uninjected control human blastocyst (n = 3) or in a blastocyst that developed following sgRNA2b–Cas9 microinjection (n = 3). Confocal projection. Scale bar, 100 μm. d, Immunofluorescence analysis for OCT4 (green), ZO-1 (magenta) and DAPI nuclear staining (blue) in an uninjected control human blastocyst (n = 2) or in a blastocyst that developed following sgRNA2b–Cas9 microinjection (n = 2). Confocal projection. Scale bar, 100 μm. e, Principal component analysis of a previously published human single-cell RNA-seq data set30 integrated with data from embryos microinjected with Cas9 protein or the sgRNA2b–Cas9 complex. Each point represents a single cell. f, Diagram summarizing the observations made in the study and their relationship to the onset of zygotic POU5F1 expression.

