Figure 5.
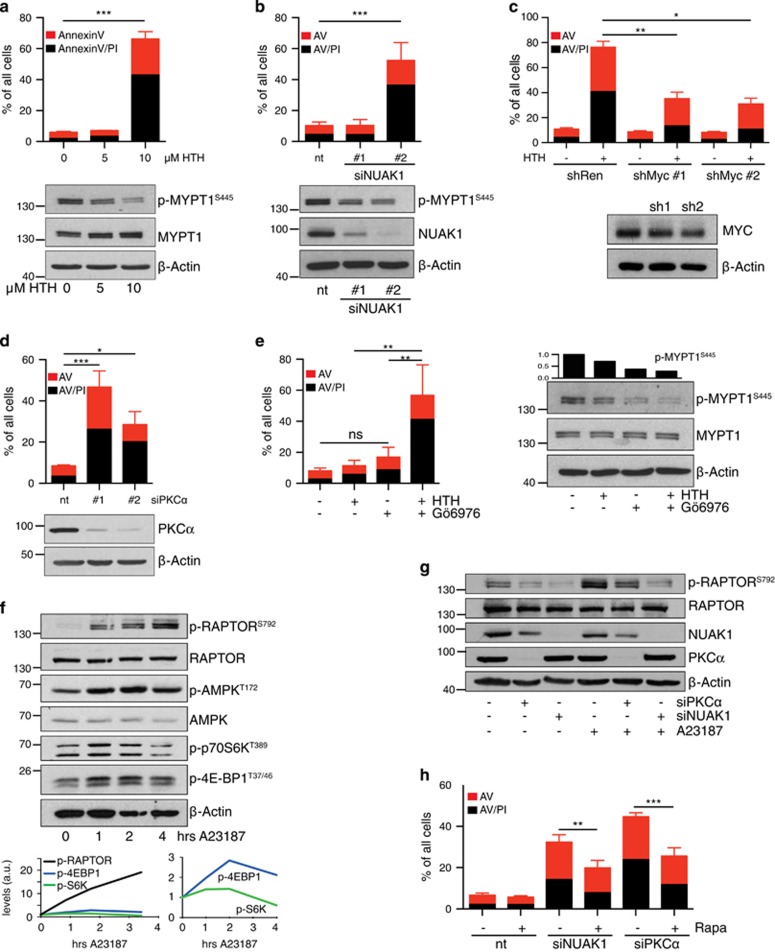
The PKCa–NUAK1 pathway supports viability of MYC-overexpressing cells. (a) Apoptosis induced in HeLa cells by the indicated doses of HTH-01-015, measured by FACS analysis of cells stained with Annexin V and propidium iodide (AV/PI) 48 h post-treatment: Red bars denote AV single-positive cells while black bars denote AV/PI double-positive cells (for a–e, h). Mean and s.d. of three independent experiments shown (a, b, d, e, h). Statistical significance was determined by one-way ANOVA, Tukey’s multiple comparison test (a–e). The immunoblot shows suppression of MYPT1 phosphorylation after 1 h treatment. (b) Apoptosis in HeLa cells induced by NUAK1 siRNA, measured 3 days post-transfection. Immunoblot shows NUAK1 and p-MYPT1 levels at 24 h. nt, non-targeting control siRNA. (c) Apoptosis induced by 10 μm HTH-01-015 in HeLa cells transfected with MYC shRNA where indicated. Mean and s.d. of technical triplicates from a representative (median) experiment shown due to wide inter-experimental variation in efficiency of MYC depletion. N=5. (d) Apoptosis induced in HeLa cells by PKCα siRNA, measured 3 days post-transfection. Immunoblot shows PKCα levels after 24 h. nt, non-targeting control siRNA. (e) Apoptosis induced in HeLa cells after treatment with 5 μm HTH-01-015±0.5 μm Gö6976 for 48 h. Immunoblot shows p-MYPT1S445 levels after 1 h drug treatment. (f) Dynamic response of the AMPK–mTORC1 pathway to calcium mobilization. HeLa cells were harvested at 0, 1, 2 and 4 h post-treatment with 3 μm A23187 and probed with the indicated antibodies. The graphs show densitometric measurements of p-RAPTORS792, p-S6KT389 and p-4EBP1T37/46 from the blots shown, normalized to Actin. N=2. (g) Lysates from HeLa cells transfected with NUAK1, PKCα or non-targeting (−) siRNA for 24 h and stimulated with 3 μm A23187 for 10 min, as indicated, probed with the indicated antibodies. N=2. (h) Apoptosis induced by depletion of either NUAK1 or PKCα in cells treated for 48 h with 100 nm Rapamycin (Rapa) or DMSO vehicle control (−), measured by AV/PI FACS. Two-way ANOVA, Sidak’s multiple comparison test.

