
Figure 3.
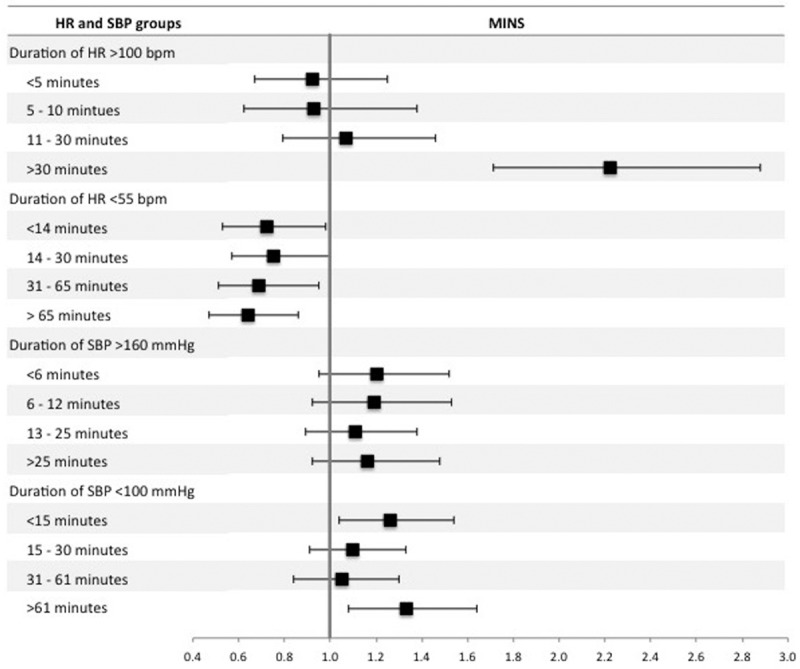
Forest plot summarizing multivariable logistic regression models for the duration of high/low intraoperative heart rate (HR) and systolic blood pressure (SBP). The dependent variable was myocardial injury after noncardiac surgery (MINS) within 30 d after surgery. There were 4 separate regression models for duration of intraoperative HR >100 beats per minute (bpm), intraoperative HR <55 bpm intraoperative SBP >160 mm Hg, and intraoperative SBP <100 mm Hg. For each model, duration was stratified into 4 approximately equal quartiles. The reference categories were patients with “normal” HR or SBP, for example in the analysis of duration of HR >100 bpm, the reference group was patients with HR ≤100 bpm. The x-axis shows odds ratios and the error bars show 95% confidence intervals. The full multivariable regression models are presented in Supplemental Digital Content, Tables 3, 4, 7, and 8, http://links.lww.com/AA/C70.