FIGURE 5.

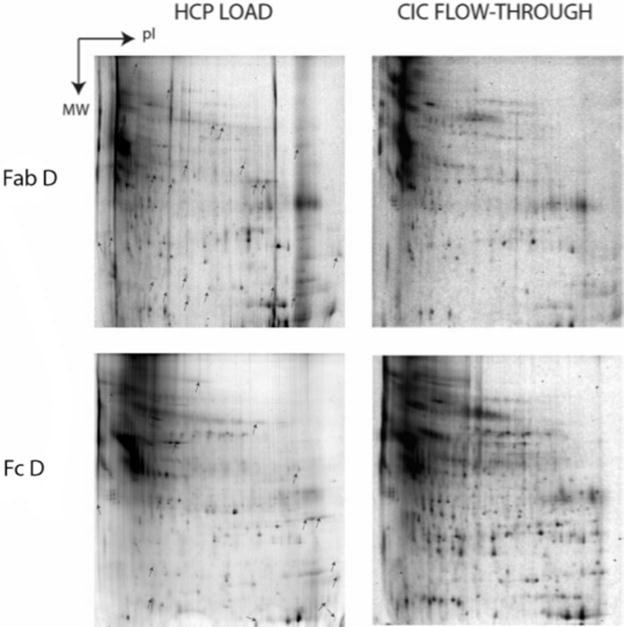
Analyzed 2-DE load (left column) and flow-through (right column) gels for HCP CIC of Fab D and Fc D. Indicated spots on ‘load’ gels are absent from corresponding flowthrough gels and represent strongly interacting HCPs.

Analyzed 2-DE load (left column) and flow-through (right column) gels for HCP CIC of Fab D and Fc D. Indicated spots on ‘load’ gels are absent from corresponding flowthrough gels and represent strongly interacting HCPs.