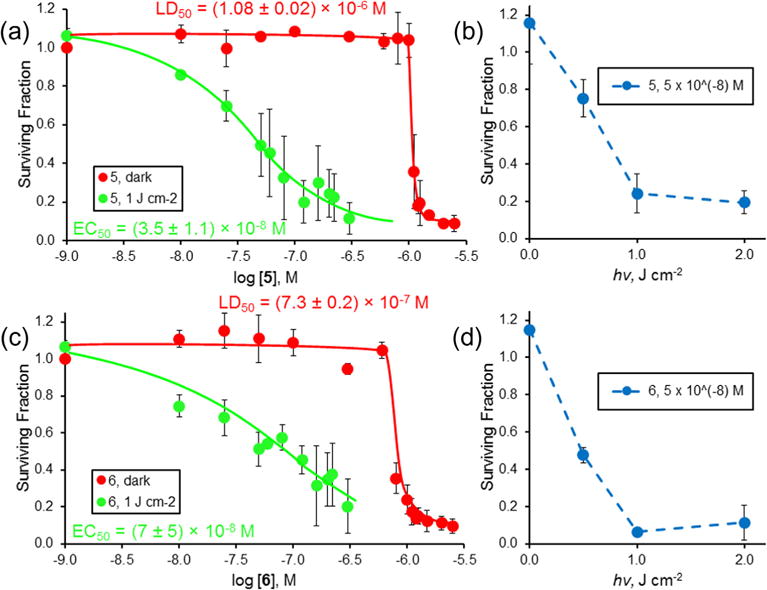
Figure 2.

Dark (
 ) and phototoxicity (
 ) of selenorhodamine thioamide 5 (a) toward HUT-78 cells with 0.0 and 1.0 J cm−2 of laser light and varying concentrations of 5 and (b) with 5 × 10⁻⁸ M 5 (
 ) and varying light dose (0.0, 0.5, 1.0, and 2.0 J cm−2) delivered at 630 ± 2 nm and a fluence rate of ~3.2 mW cm−2. (c) Dark (
 ) and phototoxicity (
 ) of selenorhodamine amide 6 toward HUT-78 cells with 0.0 and 1.0 J cm−2 of laser light and varying concentrations of 6 and (d) with 5 × 10⁻⁸ M 6 (
 ) and varying light dose (0.0, 0.5, 1.0, and 2.0 J cm−2) delivered at 630 ± 2 nm and a fluence rate of ∼ 3.2 mW cm 2. The surviving fraction was determined by MTT assay. The assays were run in triplicate. Values of EC50 (±SD) and LD50 (±SD) in (a) and (c) were determined by a sigmoidal does–response (variable slope) analysis. Error bars are ± SD.
