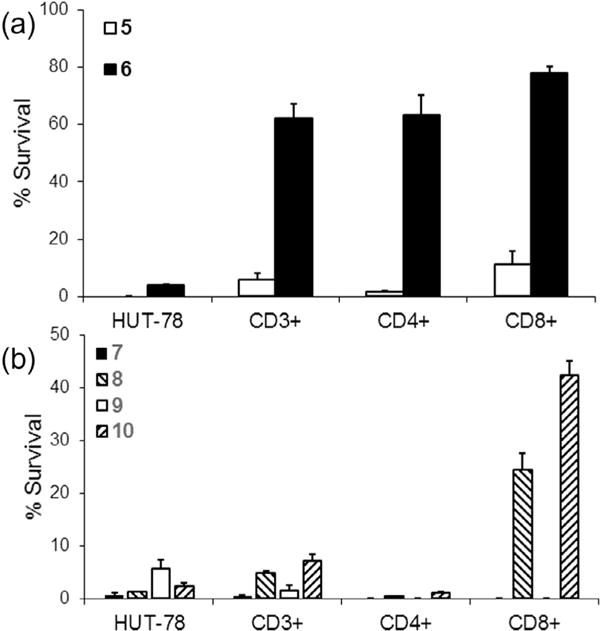
Figure 5.

Non-stimulated PBMCs were combined 5:1 with HUT-78 cells. Samples were then photodepleted (PD) with 7.5 × 10⁻⁸ M selenorhodamine 5–10 and 5 J cm−2 light. Cell survival was measured 18 h after light exposure and compared to control (non-PD samples) by FACS analysis. The bar graphs represent percent survival of malignant HUT-78, the CD3+ population, and the CD4+ and CD8+ subsets of CD3+ cells after photodepletion with selenorhodamines (a) 5 and 6 and (b) 7–10. The bars represent the mean of three replicate experiments. Error bars are the SEM.
