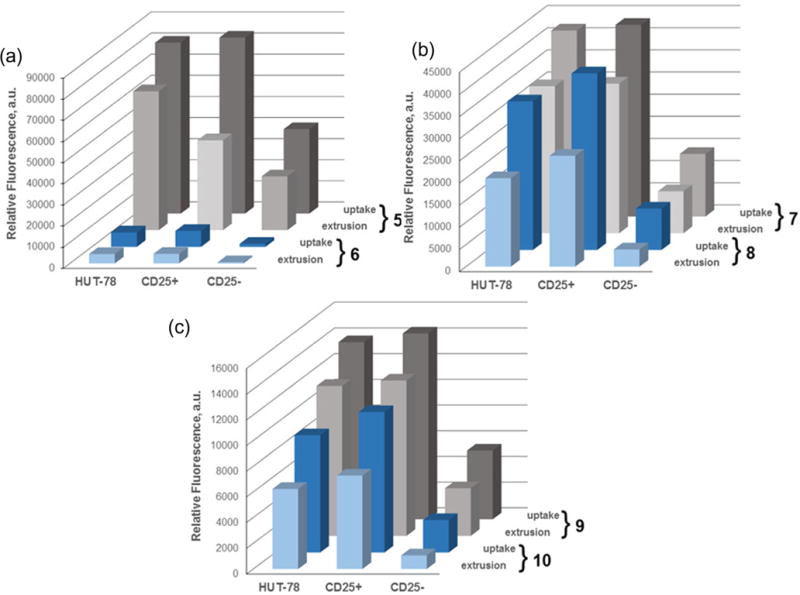
Figure 6.

SEB-stimulated PBMCs were combined 5:1 with HUT-78 cells and exposed to 7.5 × 10⁻⁸ M selenorhodamine. The bars represent mean fluorescence intensities (MFI) of selenorhodamine following (a) a 20-min uptake of 7.5 × 10⁻⁸ M selenorhodamine (uptake) and (b) a 20-min uptake of 7.5 × 10⁻⁷ M selenorhodamine followed by a 30-min extrusion in selenorhodamine-free media (extrusion) for (a) 5/6, (b) 7/8, and (c) 9/10. Values of the SEM are found in Table S3.
