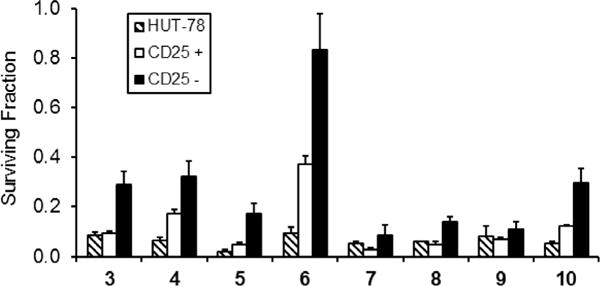
Figure 7.

Photodepletion of a 5:1 mixture of SEB-stimulated PBMCs and HUT-78 cells with 7.5 × 10⁻⁸ M selenorhodamine 3–10 and 5 J cm−2 light (600 nM, 65-Watt equivalent LED). Cell survival was measured 18 h after light exposure and compared to control (non-PD samples) by FACS analysis in 3 independent experiments. The bar graphs represent surviving fraction of malignant HUT-78, stimulated (CD25+), and resting (CD25−) T cell populations after photodepletion with photosensitizers 3–10. Mean ± SE are plotted.
