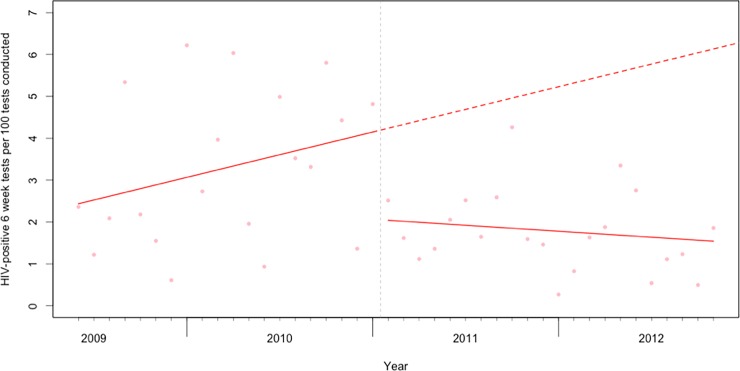
Fig 1. The rate of HIV-positive six-week tests per 100 tests conducted prior to and following the implementation of Option B in Rwanda.
The dashed vertical line represents the first month in which we expected to see the results of Option B adoption (February 2011, 3 months after the implementation of Option B in November 2010). The solid red lines show the fitted values from the interrupted time series model, and the dashed red line the predicted counterfactual trend absent the policy change.

