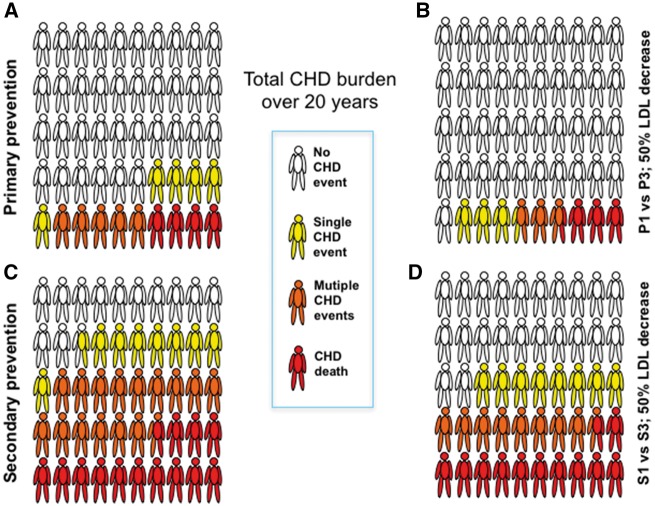
Figure 2.
CHD impact over 20 years for groups P1 vs. P3 and S1 vs. S3 expressed as percentages of subjects experiencing a fatal CHD event, multiple non-fatal CHD events or a single CHD event. These are depicted schematically per 50 subjects for the purposes of clarity. Note, if a subject has both a non-fatal and then a fatal event, he is counted for both in order to show the total CHD burden. Complete data are provided in Supplementary material online, Tables S1 and S2.

