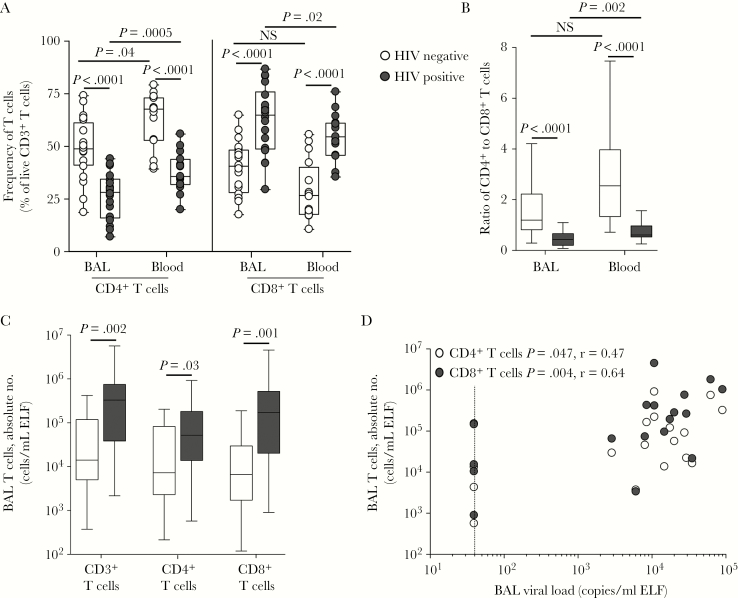
Figure 1.
T-cell frequencies and absolute numbers in blood and bronchoalveolar lavage. A, The frequencies of CD4+ and CD8+ T cells in blood and bronchoalveolar lavage (BAL) of human immunodeficiency virus (HIV)–infected (n = 18) and uninfected (n = 20) individuals, for whom ex vivo flow cytometry phenotyping data were available. Data are shown as box and whisker plots, with horizontal bars representing medians, boxes denoting interquartile ranges, and whiskers denoting ranges. Each dot represents an individual. The frequency of CD4+ and CD8+ T cells is shown as a percentage of live CD3+ T lymphocytes, determined by flow cytometry. B, Ratios of CD4+ to CD8+ T cells in BAL and blood specimens for HIV-infected (black bars) and uninfected (white bars) individuals. C, The absolute number of CD3+, CD4+, and CD8+ T cells in BAL from HIV-infected and uninfected individuals. D, The association between absolute CD4+ and CD8+ T-cell counts and BAL viral load. The dotted line indicates the limit of detection of the viral load assay. Statistical comparisons were performed using the nonparametric Mann-Whitney test for unpaired comparisons, the Wilcoxon test for paired samples, and Spearman rank correlation. ELF, epithelial lining fluid; NS, not significant.

