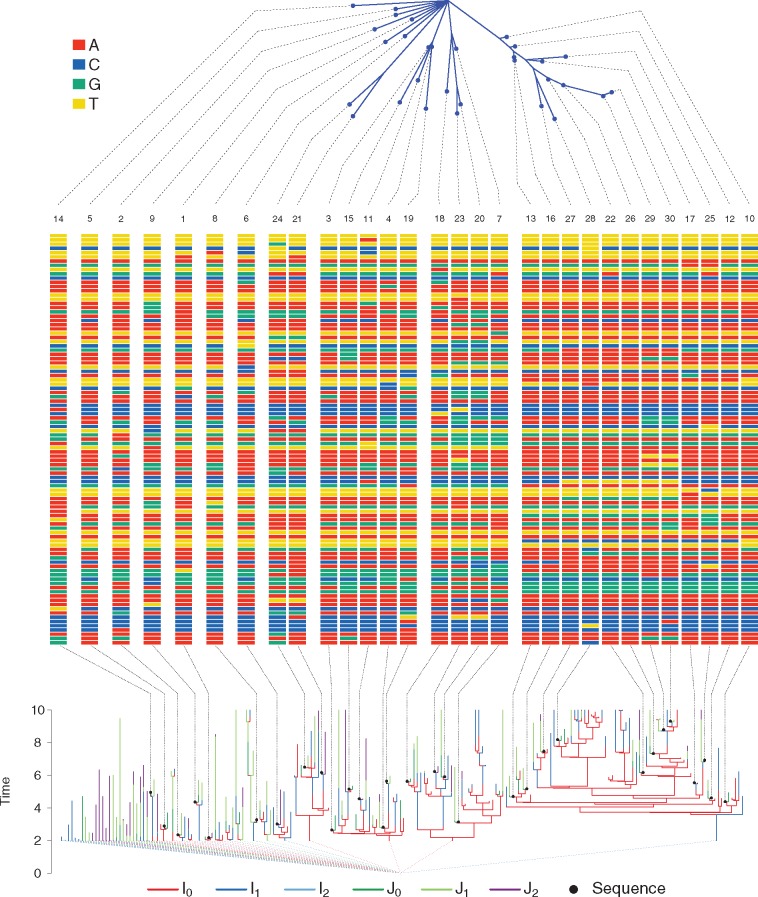
Fig. 3.
A simulated transmission forest (bottom), its associated pathogen genetic sequences (middle), and the phylogeny of the sequences (top). The class of the infected individual in the transmission forest is indicated by its color. Black dots represent genetic sequences. Black dashed lines connect sequence locations on the transmission tree, or the phylogeny, to visualizations of the sequences in the middle panel. Colored dashed lines from the roots of transmission trees connect at the polytomy at troot = 0. Numbers at the top of the sequences indicate the rank of the sequence, with rank 1 being the first observed.

