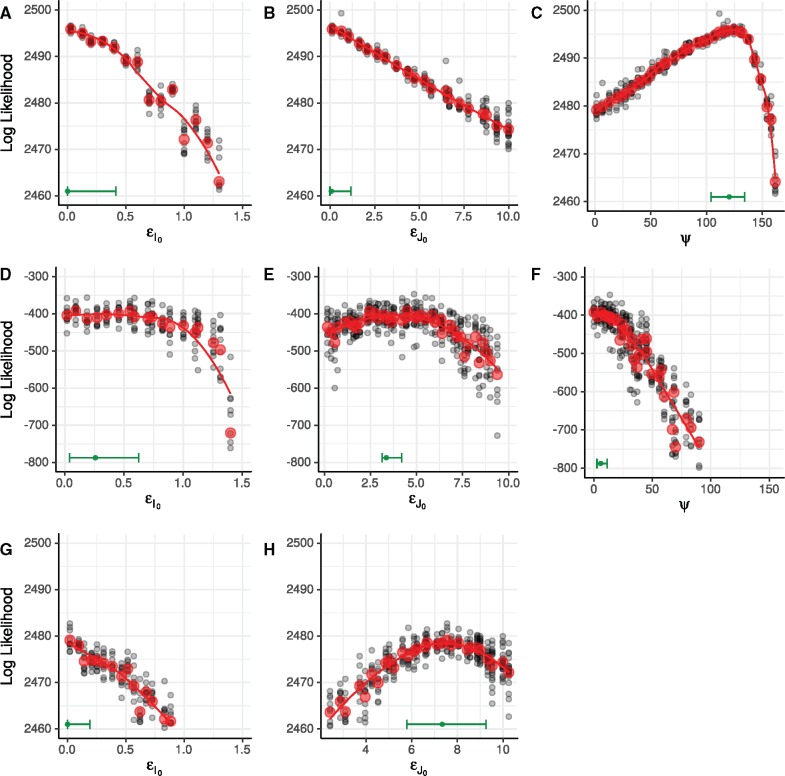
Fig. 6.
Estimated likelihood profiles from fits to data from the black, MSM cohort. (A–C) show likelihood profiles computed using only the diagnosis likelihood. (D–F) show likelihood profiles computed using both the diagnosis likelihood and the genetic likelihood. (G, H) show likelihood profiles computed using only the diagnosis likelihood when ψ is fixed at zero. Black dots represent particle filter likelihood evaluations of parameter sets obtained using iterated filtering. Red dots represent mean log likelihoods of the multiple likelihood evaluations (black dots) at each point in the profile. Red lines are loess fits to the red dots. Green bars along the lower margin of each panel encompass 95% confidence intervals for each parameter. Confidence intervals account for both statistical uncertainty and Monte Carlo noise (Ionides et al. 2016). The smoothed profile was calculated on the square root scale, appropriate for non-negative parameters, with a green dot indicating the maximum.

