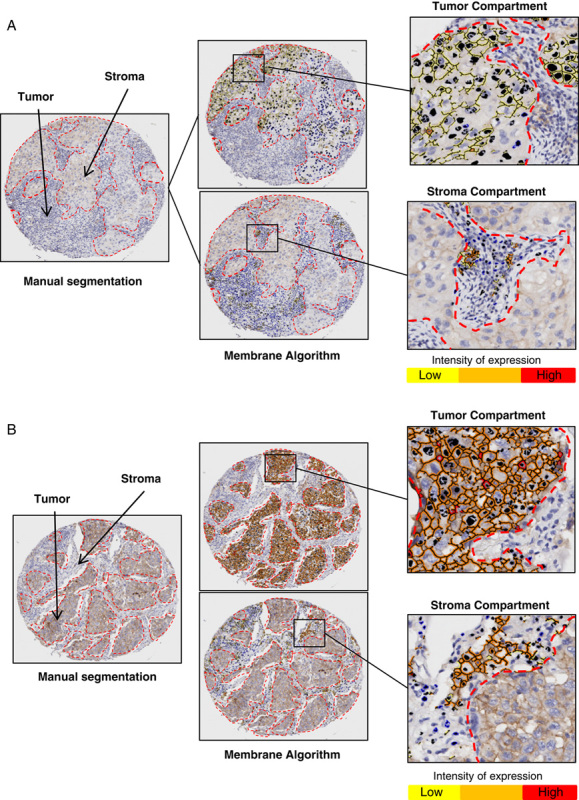
FIGURE 1.

Microphotographs of representative examples of the computer algorithm (Aperio toolbox) used to analyze the IHC PD-L1 expression (brown staining) in MCs on tumor compartment and TAICs on stroma compartment (A and B). Images of PD-L1 IHC expression processed using a manual segmentation of tumor and stroma compartments (left), membrane algorithm using to the analysis (upper and lower meddle) and image analysis quantification using the membrane algorithm by intensity in tumor compartment (upper right) and in the tumor and stroma compartments (lower right). IHC indicates immunohistochemistry; MCs, malignant cells; PD-L1, programmed cell death ligand 1; TAICs, tumor-associated inflammatory cells.
