Figure 1.
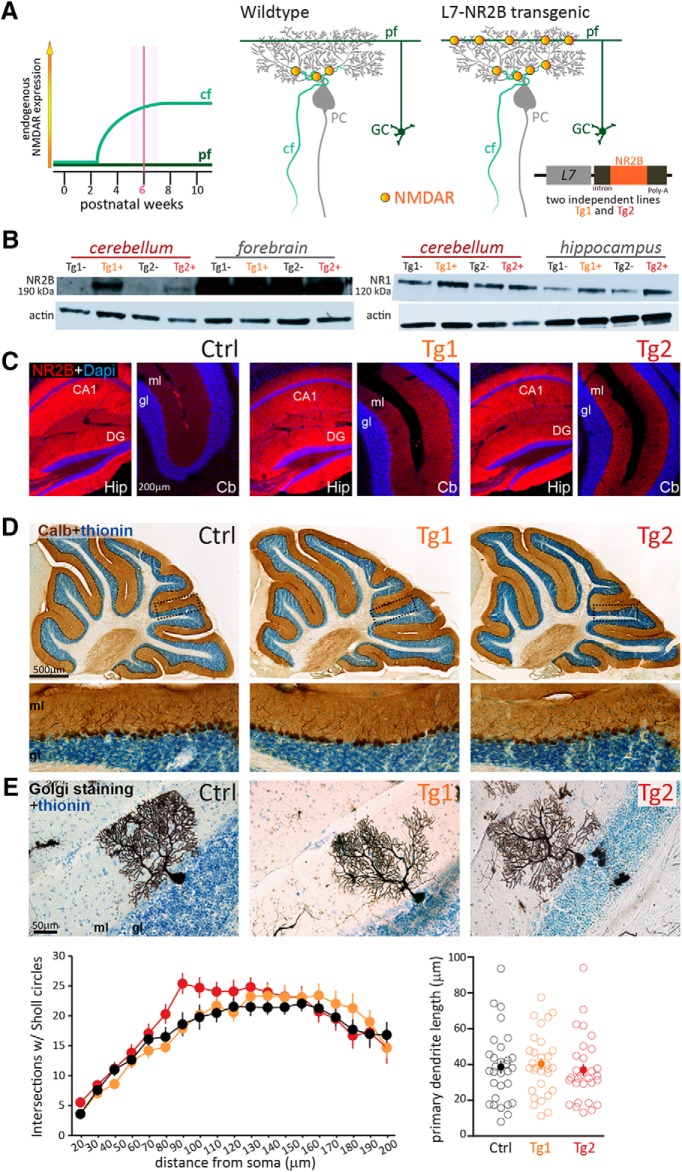
Generation of NR2B transgenic mice. A, Schematic representation of the expression of endogenous NMDARs at CF-PC and PF-synapses over the wild-type mouse lifetime. All experiments performed in the following figures are performed at 6 ± 1 weeks of age (for details, see Materials and Methods). Middle, Scheme depicting the expression of NMDAR (dots) in a wild-type mouse at the synapses formed on the PC dendritic tree by CFs. Synapses formed by PFs (the axons of granule cells, GC) do not have NMDARs. Right, Same schematic representation of synapses onto PCs in the L7-NR2B + Tg transgenic mouse. Note that NMDARs are present also at the PF-PC synapse. Inset, Details of the vector used to generate the two independent lines used in the study. B, Western blotting gels containing homogenates of adult cerebella, forebrains, and hippocampi of two transgenic mice (Tg1+ and Tg2+) and their control littermates (Tg1- and Tg2-). The left blot was processed with an anti-NR2B antibody, which visualizes a band at 190 kDa, the right one with an anti-NR1 antibody (120 kDa). Actin was used as loading control; note that the ratio of NR labeling to actin labeling should be taken into account for assessing the amounts of protein present. C, Confocal immunofluorescent images of NR2B-immunoreactivityin dorsal hippocampus (Hip) and cerebellar cortex (Cb) in control (left), Tg1 (middle), and Tg2 (right) mice. Note in control mice, the low level of NR2B labeling (blue) in the cerebellum as compared to hippocampal CA1 and dentate gyrus (DG). In addition, note moderate increased labeling in cerebellar molecular layer (ml) of transgenic mice. D, Low- and high-magnification images of calbindin immunoreactivity in sagittal cerebellar sections illustrating the normal appearance of cerebellar gross morphology and PCs of adult transgenic (Tg1 and Tg2) mice. E, top, High magnification of individual Golgi-stained PCs (black) of control (left) as well as Tg1 (middle) and Tg2 (right) NR2B mice, counterstained with thionin (blue). Bottom, Sholl analysis of the dendritic arborization of PCs (left) and length of their primary dendrites (right) for control (black, n = 30, N = 4), Tg1 (orange, n = 30, N = 3), and Tg2 (red, n = 30, N = 4) NR2B mice. Empty circles indicate individual data points, full circles indicate mean ± SEM.

