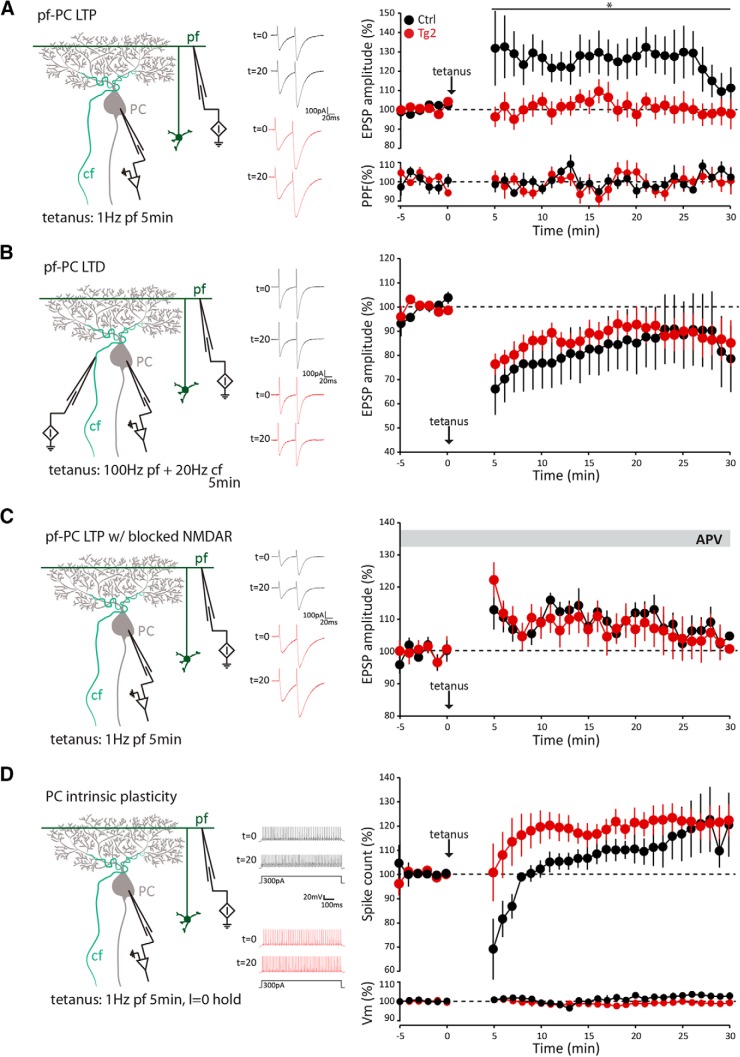
Figure 3.
PF-PC LTP is selectively affected in transgenic mice. A, LTP was induced by PF stimulation at 1 Hz for 5 min in six-week-old transgenic (Tg2, red, n = 8) and control (Ctrl, black, n = 7) mice. The normalized paired-pulse ratio (50-ms interstimulus interval) of the recordings of the same cells is plotted below. B, LTD was induced as described in A, but with concomitant CF activation (Ctrl, n = 8; Tg2, n = 8). C, Similar to A, but with the NMDAR blocker D-AP5 present in the extracellular solution (Ctrl, n = 7; Tg2, n = 8). D, Induction of IP by 5 min of PF stimulation at 1 Hz did not result in significant differences between transgenic and control mice (both N = 6). The normalized membrane potentials of the same cells are represented below. The scheme at the left of each panel depicts the respective recording configuration, while the middle example traces of Ctrl (black) and Tg2 (red) EPSCs (A–C) or action potentials (D) recorded before (t = 0 min) and after (t = 20 min) the tetanic stimuli show the plastic changes. Values are mean ± SEM; *p < 0.05; **p < 0.01; absolute p values are indicated in the main text.

