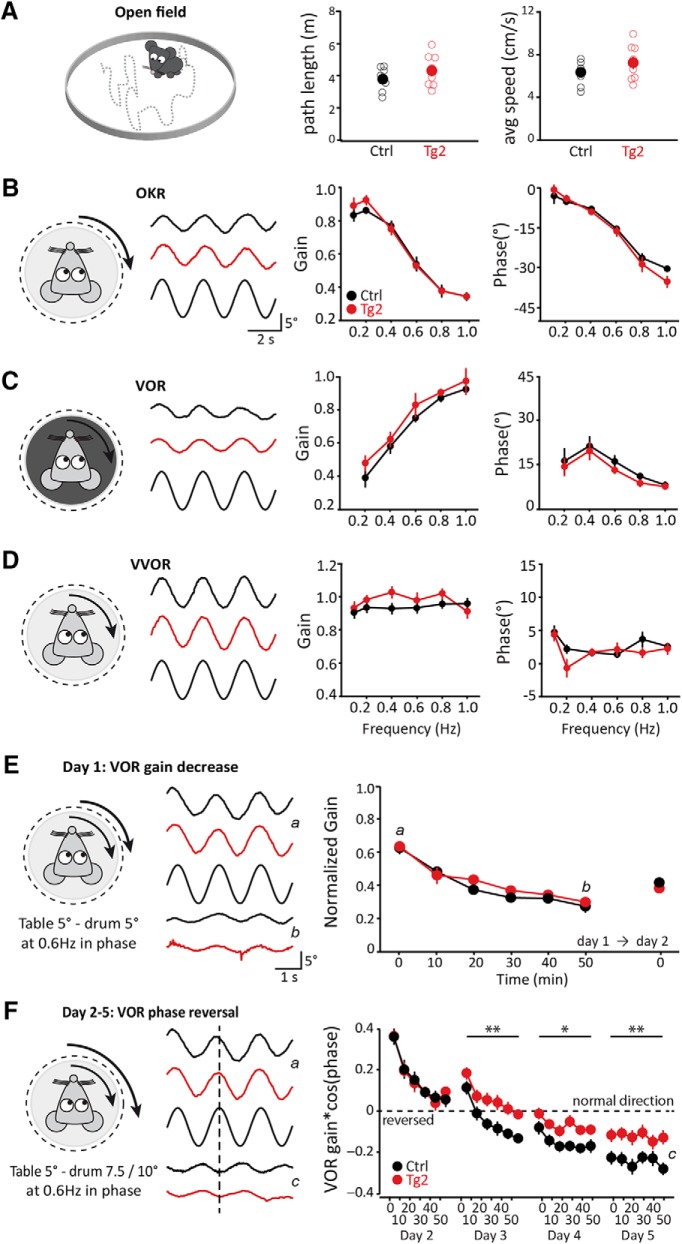
Figure 4.
Motor performance is normal, but motor learning is impaired in transgenic mice. A, Distance traveled and average speed in the open field for transgenic (Tg2, red, n = 8) and control (Ctrl, black, n = 7) mice. B–D, Baseline compensatory eye movements (examples traces for 0.4 Hz, middle left) quantified by gain (middle right) and phase (right) for Tg2 mice (red, n = 9) and control (Ctrl, black, n = 10) mice: (B) OKR; (C) VOR (in the dark); and (D) VVOR (in the light), schematized on the left of each respective panel. E, left, Representation of gain-decrease training paradigm (day 1: 5 × 10 min sinusoidal, in-phase drum and table rotation at 0.6 Hz, both with an amplitude of 5°; day 2: VOR gain measurement at 0.6 Hz). Middle, Example traces of before (time point, t = 0, indicated by a) and after (t = 50 min, b) adaptation. Right, Normalized gain for VOR recorded with 10-min intervals during 50-min training session for six-week-old Tg2 mice (red, n = 8) and control (Ctrl, black, n = 11) mice on day 1 and a single measurement at day 2. F, Similar to E; following the gain-decrease protocol, for four consecutive days the six-week-old transgenic and control mice were subjected to the phase reversal protocol (5 × 10 min sinusoidal in-phase drum and table rotation at 0.6 Hz, but with drum amplitudes of 7.5° on day 2 and 10° on days 3–5, while the table amplitude was 5°). VOR responses (middle: example traces, a same as E, c: t = 50 min on day 4) are depicted as gain of eye movement multiplied by the cosine of its phase, gain*cos(phase). Negative values here indicate a phase larger than 90° and the (theoretical) goal of the training is a value of -1. Empty circles represent individual data points, full circles are mean ± SEM; p values are indicated in the main text; asterisks indicate significant difference.

