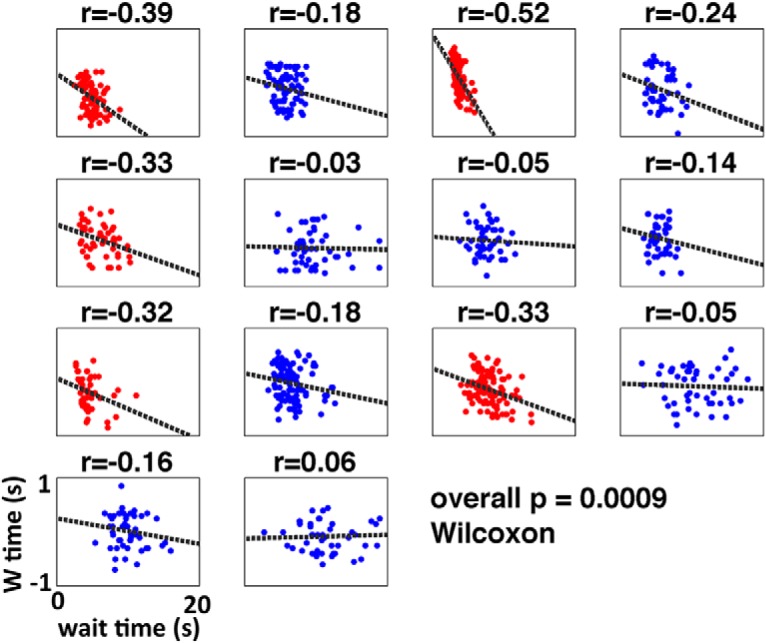
Figure 9.

‘W’ time as a function of waiting time per subject. Correlation between waiting time and ‘W’ time for the empirical data grouped by subject. The horizontal axis is the waiting time (from 0 to 20 s) and the vertical axis is ‘W’ time in seconds with respect to movement onset. Data are shown in red if the correlation is individually significant at p < 0.05. When the r values for all subjects are submitted to a Wilcoxon signed rank test the effect is significant at p < 0.001. Also, the probability of 13 subjects (out of 14) individually exhibiting a negative correlation is 0.0009 (binomial test).
