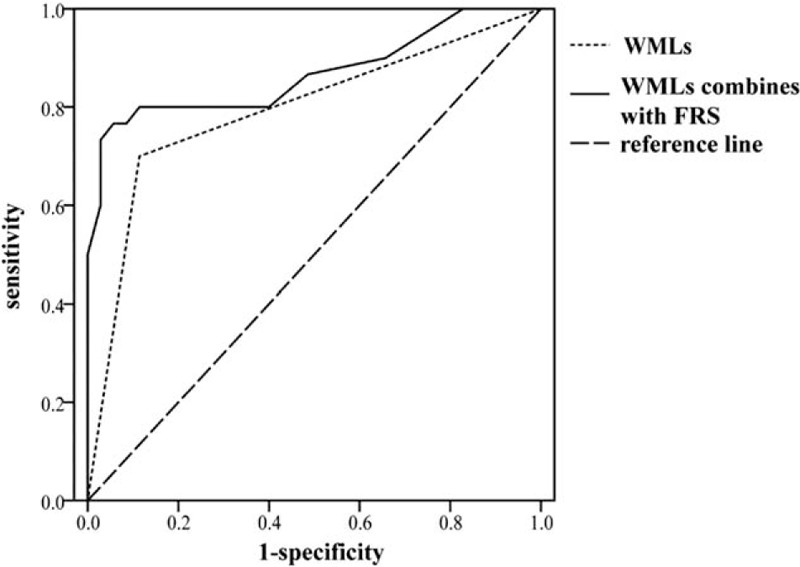
Figure 3.

Predictive value of WMLs and FRS for the diagnosis of VaD. Comparison of predictive value between WMLs and FRS combined WMLs for the diagnosis of VaD (AUC = 0.788 vs 0.863, P < .05). FRS = Framingham risk score, WMLs = white matter lesions.
