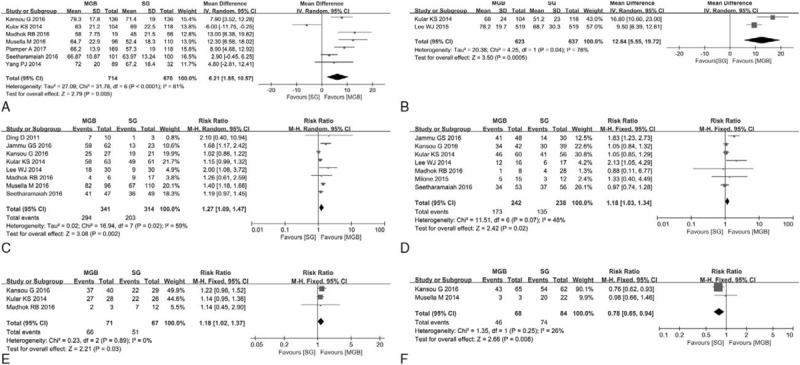
Figure 3.

(A) 1 year EWL% of MGB versus SG. (B) 5 years EWL% of MGB versus SG. (C) T2DM remission rate of MGB versus SG. (D) Hypertension remission rate of MGB versus SG. (E) OSA remission rate of MGB versus SG. (F) Ostearthritis remission rate of MGB versus SG. EWL = excess weight loss, MGB = mini-gastric bypass, OSA = obstructive sleep apnea, SG = sleeve gastrectomy, T2DM = type 2 diabetes mellitus.
