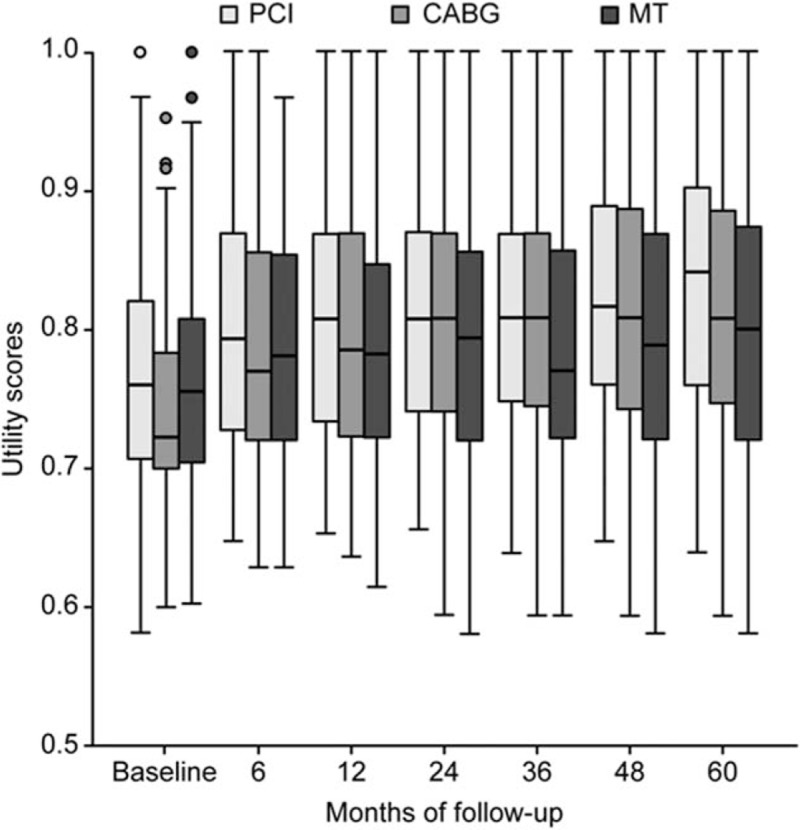
Figure 3.

Box-plot graph showing medians and interquartile ranges of utility evaluation of the medical treatment (MT), percutaneous coronary intervention (PCI), and coronary artery bypass graft (CABG) patients over the course of the trial.

Box-plot graph showing medians and interquartile ranges of utility evaluation of the medical treatment (MT), percutaneous coronary intervention (PCI), and coronary artery bypass graft (CABG) patients over the course of the trial.