Figure 1.

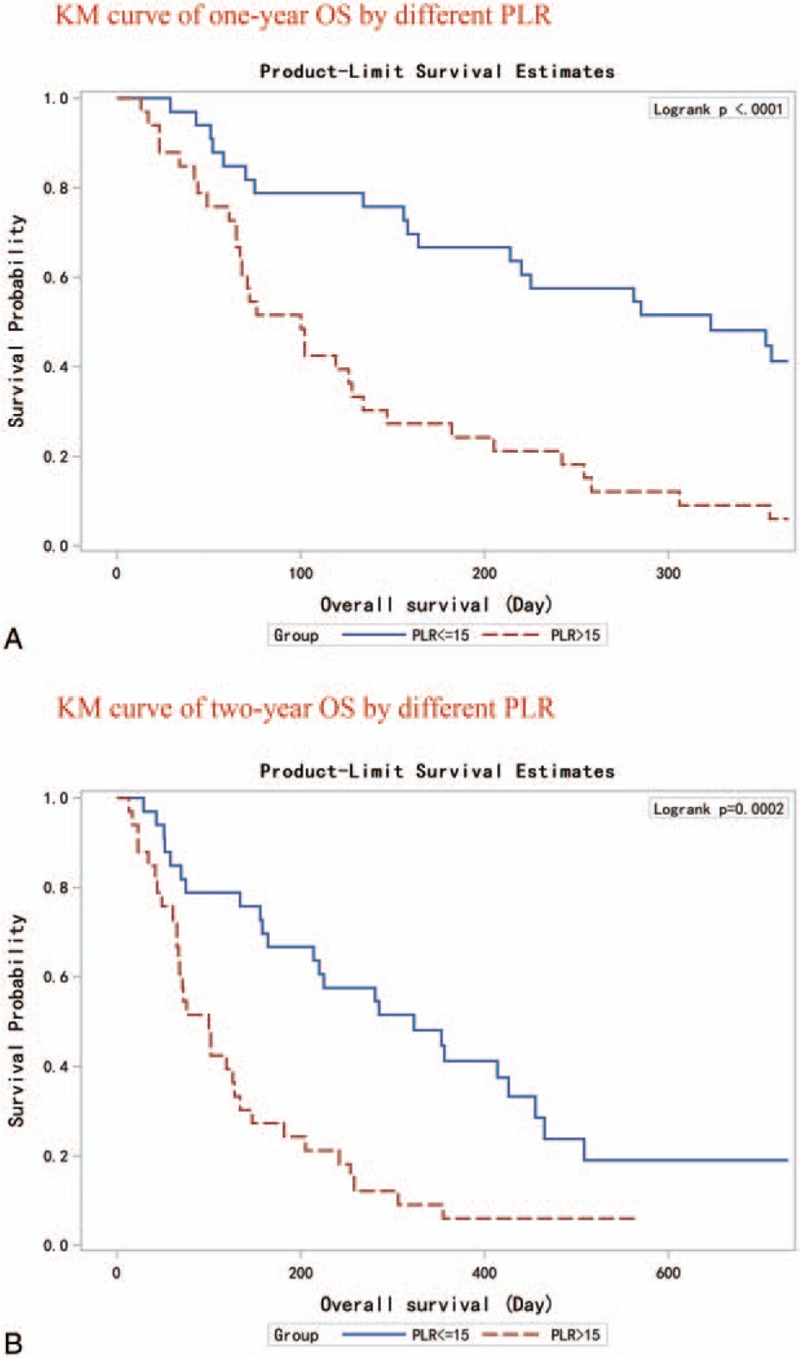
Kaplan–Meier curves for PC patients with different baseline PLR. (Panel A) 1-year OS. (Panel B) 2-year OS. OS = overall survival, PC = pancreatic cancer, PLR = platelet to lymphocyte ratio.

Kaplan–Meier curves for PC patients with different baseline PLR. (Panel A) 1-year OS. (Panel B) 2-year OS. OS = overall survival, PC = pancreatic cancer, PLR = platelet to lymphocyte ratio.