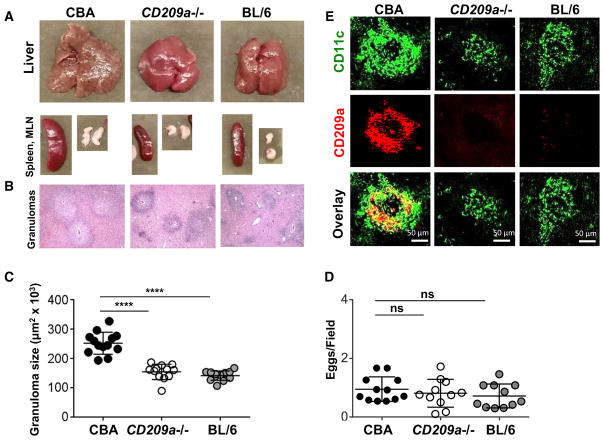
Figure 1. The Loss of CD209a Results in Marked Decrease in Egg-Induced Granulomatous Inflammation.
CBA, CD209a−/−, and BL/6 mice infected with S. mansoni were sacrificed at 7 weeks post-infection.
(A) Representative images of livers, spleens, and MLNs from infected mice.
(B) Histopathology of liver granulomas (magnification, 100×).
(C) Granuloma size determined by morphometric analysis. Each dot represents average granuloma size of 10–20 granulomas in two sections from individual mice.
(D) Number of eggs per 2.4-mm2 field assessed on H&E-stained liver sections at 100× magnification. An average of 16 fields per liver section was assessed. Data in (C) and (D) represent pooled results from three independent experiments with three to five mice per group.
(E) Liver cryostat sections were stained for CD209a (red) and CD11c (green) and examined by confocal microscopy. Images are representative of three independent experiments. For this and all figures: *p < 0.05, **p < 0.005, ***p < 0.0005, ****p < 0.00005; ns, not significant.

