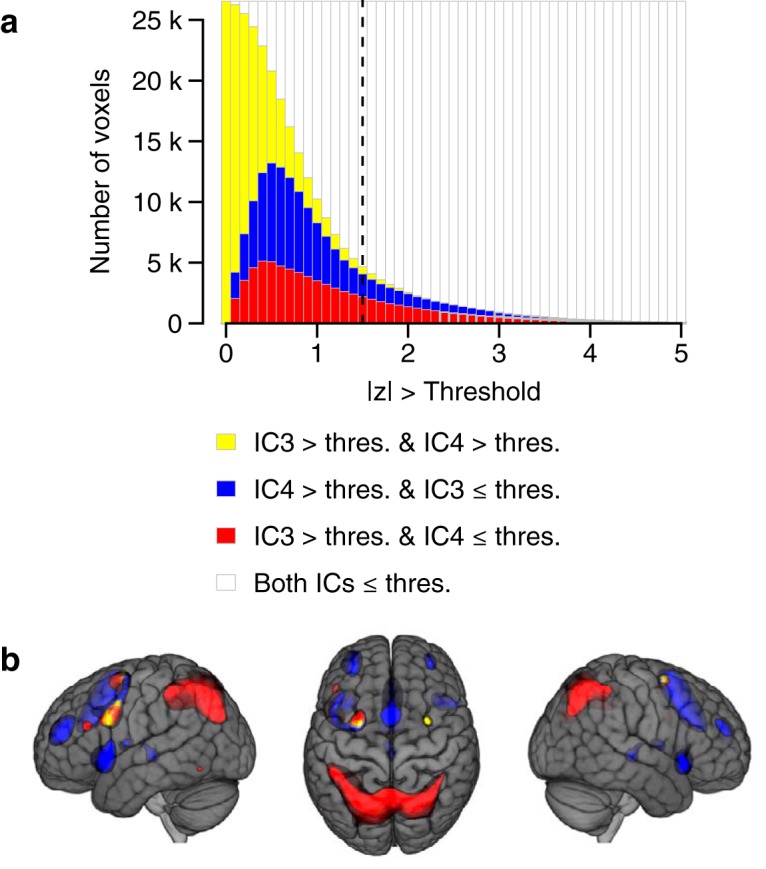
Figure 4.

Overlap between WMN-IC3 and WMN-IC4. A, The effects of curtailing the voxel loadings of WMN-IC3 and WMN-IC4 using different thresholds ranging from |z| > 0 to |z| > 5 (x-axis). Stacked bars (y-axis) depict the share of all N = 26542 voxels that load onto both WMN-IC3 and WMN-IC4 (yellow; i.e., overlap between WMN-IC3 and WMN-IC4), onto WMN-IC4 but not WMN-IC3 (blue), onto WMN-IC3 > thres but not WMN-IC4 ≤ thres (red), and onto neither WMN-IC (white) above the threshold indicated by the x-axis. The dashed vertical line highlights the share of voxels loading onto the WMN-ICs above a threshold of |z| > 1.47. This threshold includes the most extreme 10% of values across all WMN-ICs and was used for illustrating the brain images and to determine the overlap between WMN-IC3 and WMN-IC4 throughout the paper. B, Brain regions loading with z > 1.47 onto both WMN-IC3 and WMN-IC4 (yellow; i.e., overlap between WMN-IC3 and WMN-IC4), only onto WMN-IC4 (blue), and only onto WMN-IC3 (red). The anatomic annotations of clusters loading onto both WMN-IC3 and WMN-IC4 when considering the most extreme 10% of loadings are described in Extended data Figure 4-1. The brain images are displayed within the MNI152 template and according to neurologic convention.
