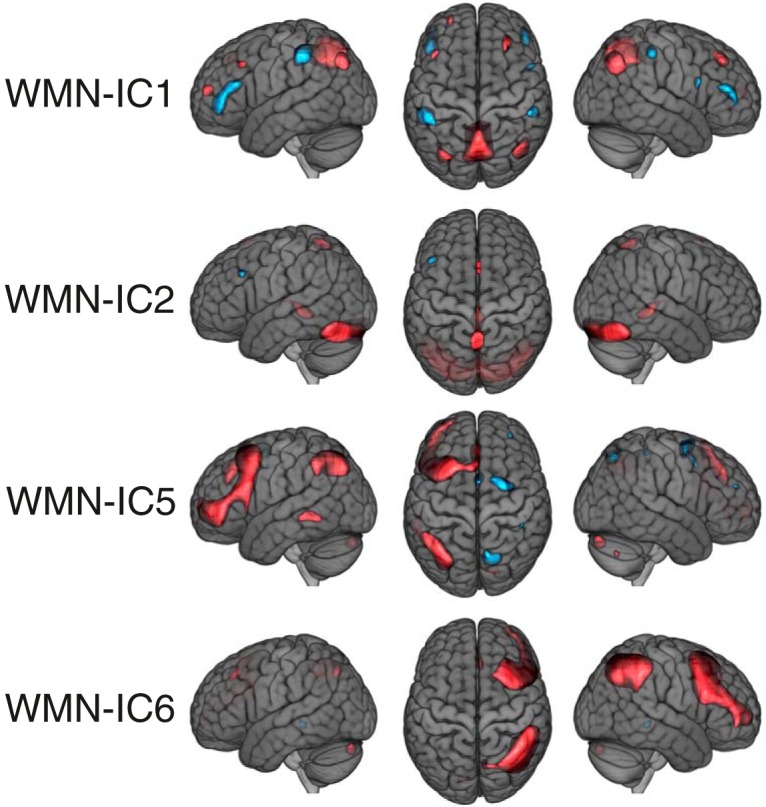
Figure 5.

WMN ICA decomposition voxel loadings of the remaining WMN-ICs. The threshold of |z| > 1.47 used for illustration displays the most extreme 10% of the voxel loadings across all WMN-ICs; red depicts positive and blue negative voxel loadings. The brain images are displayed within the MNI152 template and according to neurologic convention.
