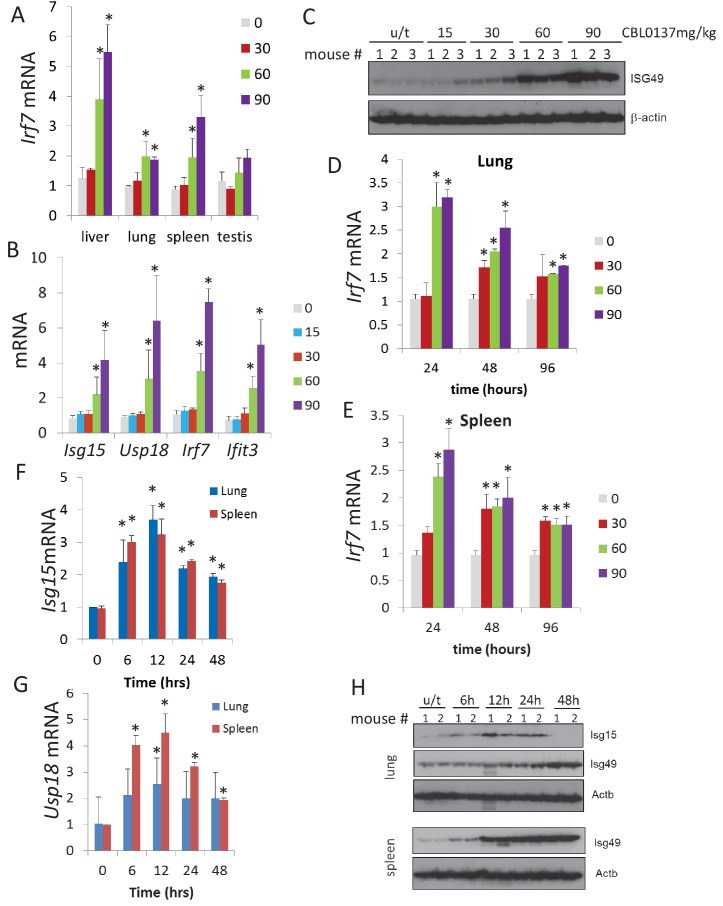
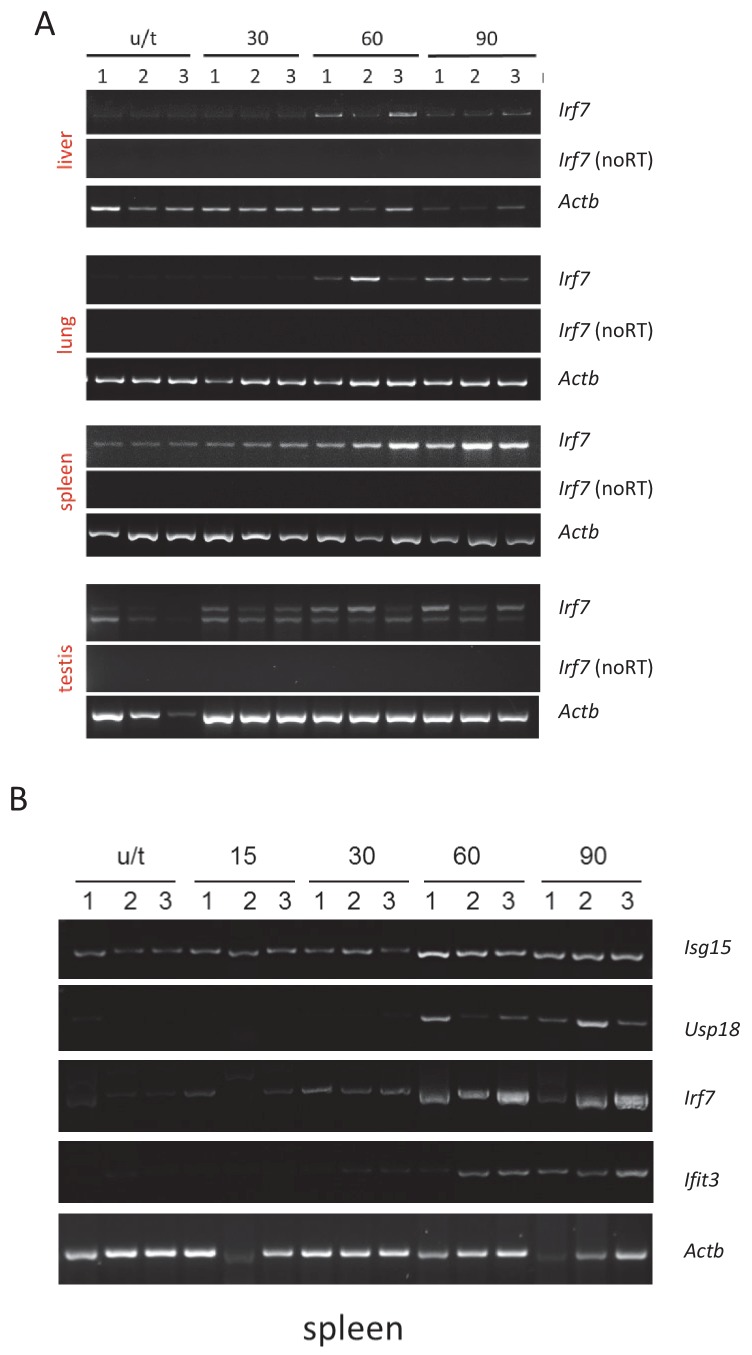
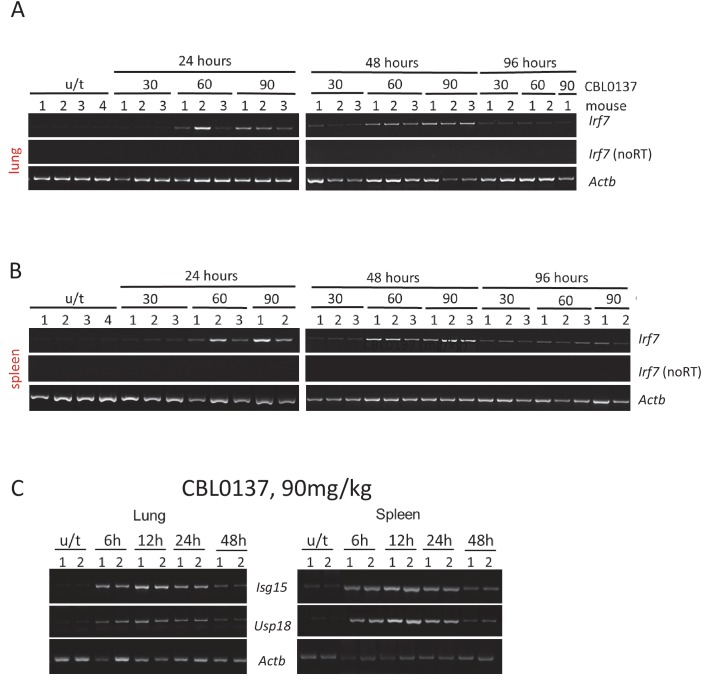
Figure 3. CBL0137 causes increased expression of IFN-responsive genes in different tissues of mice.
Quantitation of RT-PCR data (A, B, D, E, F, G) shown as fold change upon treatment with different doses of CBL0137 (mg/kg) comparing to vehicle-treated control. Mean values from three mice ± SD. Immunoblotting of mouse plasma (C) or tissue lysates (H). (A) Treatment of C57Bl/6 mice for 24 hr. B and C. Treatment of NIH Swiss mice for 24 hr. D - H. Different time treatment of C57Bl/6 mice. C and H – numbers indicate individual mice in each group. Bars – mean of two or three replicates +SD, asterisk – p<0.05 vs untreated control.


