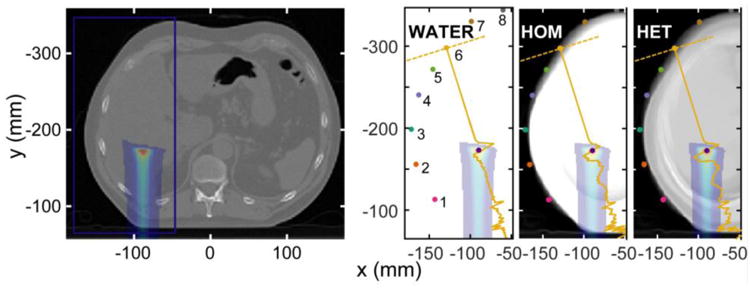
Figure 3.

A transverse slice through the liver CT is shown (left) with the single PBS spot dose deposition and simulation volume boundary. The average HU of each simulation volume for the three cases are shown at right. The average x,y position of each detector set is shown along with a characteristic protoacoustic trace superimposed on the image. The detector sets are numbered counterclockwise from the lower left (as labeled in the WATER image).
