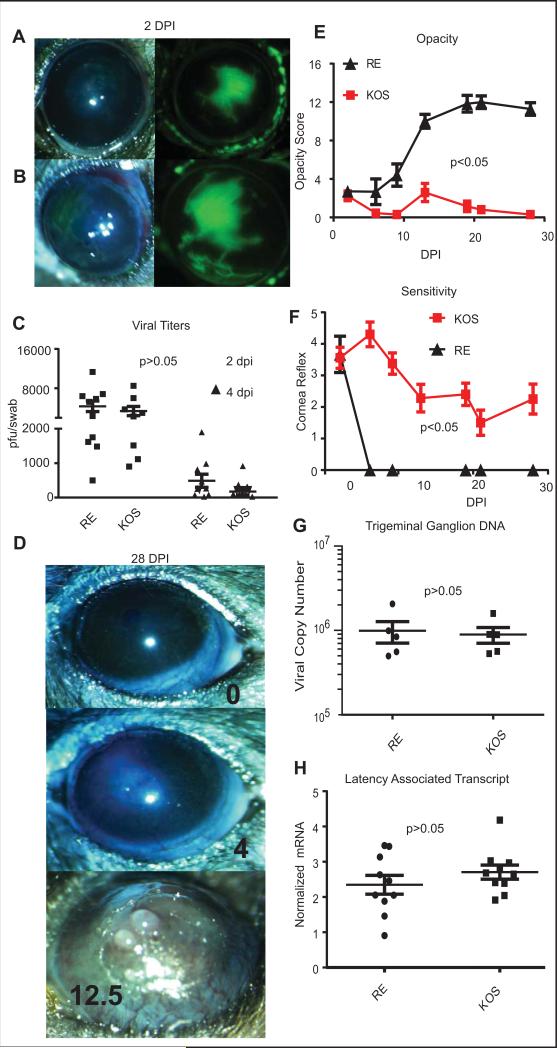
Figure 1. Corneal pathology induced by RE and KOS HSV-1 infections.
Photomicrographs of C57BL/6 corneas were obtained 2 days after infection with 1x10⁵ pfu per eye of HSV-1 RE (A) or HSV-1 KOS (B) and lesions were visualized with fluorescein sodium (green). Viral titers were assessed in eye swabs obtained at 2 and 4 dpi using a standard plaque assay (C), and the significance of differences in mean titers of the two viruses was assessed by two-way ANOVA. Photomicrographs obtained at 28 dpi (D) show the absence of overt pathology typically observed in KOS infected mice (top panel). A small fraction of KOS infected mice did show mild opacity (middle panel) and these mice were excluded from subsequent experiments described in other figures. RE HSV-1-infected corneas exhibit typical severe HSK (bottom panel). Opacity scores (12 point scale) are listed. Corneal opacity was tracked over time (E) with n=20 HSV-1 KOS infected and n=14 HSV-1 RE infected corneas from pooled experiments. Mice were monitored for corneal sensitivity by touching the four quadrants of the peripheral cornea and the central cornea and recording the number of areas of each cornea that retained blink reflex. A score of 5 indicates complete responsiveness in all areas of the cornea test and score of 0 indicates a cornea lacking reflex to palpation of any area of the cornea. (F) n=25 HSV-1 KOS infected, n=10 HSV-1 RE infected from pooled experiments. RE HSV-1 infected corneas completely lost sensation, while KOS infected corneas all retained at least partial sensation. For both opacity (E) and sensitivity (F) the area under the curve was calculated for each cornea and p values for group differences determined by a Student's T-test for each experiment. Trigeminal ganglia (TG) were obtained from KOS and RE HSV-1 infected mice at 28-34 dpi, DNA or RNA was extracted, and the viral genome copy number per TG quantified by qPCR (G) or levels of Latency Associated Transcript (LAT) mRNA were quantified by qRT-PCR normalized to the expression of histone H1 host gene. Viral genome copies and LAT expression were compared via student's T-test (data are representative of 1 of 4 experiments for genome comparison and of 1 of 3 experiments for LAT comparison).

