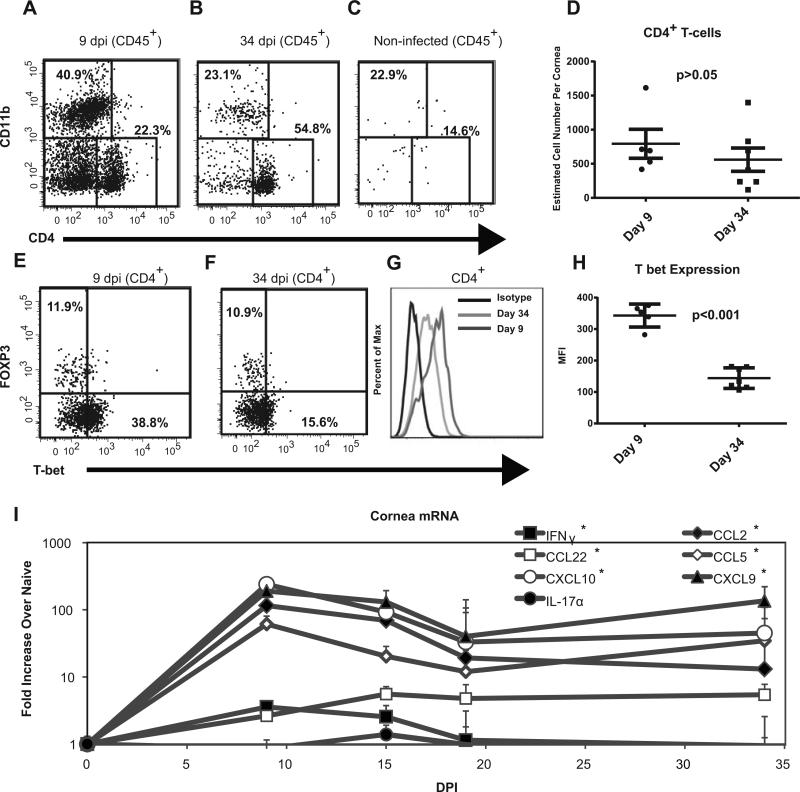
Figure 2. Persistent subclinical inflammation in KOS HSV-1 infected corneas.
The corneas of female C57BL/6 mice were infected with 1×10⁵ pfu of HSV-1 KOS, excised at 9 dpi (A, E, D, G, H) or 34 dpi (B, F, D, G, H), stained for surface CD45, CD4, CD11b, and TCRβ and for intracellular T-bet and Foxp3, and were analyzed by flow cytometry. Non-infected corneas were included for comparison. Representative flow plots gated on CD45+ cells show the frequency of CD4+ and CD11b+ cells (A-C). TCRβ was expressed on all CD4+ but no CD11b+ cells (not shown). The absolute number of CD45+CD4+ TCRβ + cells/cornea is shown with the mean and SEM represented by horizontal and vertical lines, respectively (D). The CD45+CD4+ TCRβ+ were analyzed for Foxp3 and T-bet (E-H). A histogram (G) and graph of mean fluorescence intensity (MFI) (H) for T-bet staining in CD4+ T cells from pools of corneas is shown (T-bet and FOXP3 data is representative of 1 of 2 experiments). The values were compared via student's T-test. Total RNA was extracted from HSV-1 KOS infected corneas obtained at various times after infection and analyzed for cytokine and chemokine mRNA using nanostring technology (I) n=3-5 mice per time point. Transcript levels are recorded as a fold increase over that observed in non-infected (naïve) corneas. Relative gene expression over time was compared using a Kruskal-Wallis test, (*) indicates a p < 0.05.

