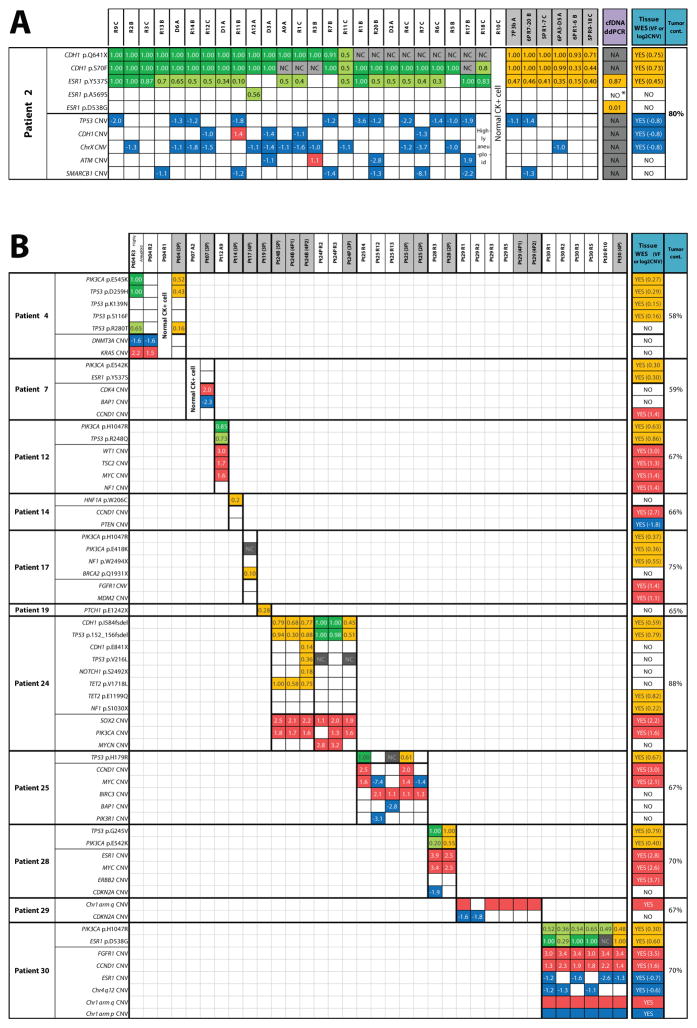
Figure 2. Integrative heat map of somatic molecular alterations identified in archived circulating tumor cells (CTC) and comparison with metastatic tissue in endocrine therapy-resistant metastatic breast cancer patients.
Next generation targeted sequencing for circulating tumor cells (CTC), whole exome sequencing (WES) for tissue biopsy, and digital droplet PCR (ddPCR) for cell free tumor DNA (cfDNA) identified high confidence mutations (top half of each patient table) and copy number alterations (CNAs) (bottom half) in A) Patient #2 and B) Patients #4 – 30. Colored boxes indicate presence of alteration, empty boxes represent absence of alteration (despite adequate sequencing coverage for the position). NC = no adequate sequencing coverage to evaluate mutation presence; NA = not assayed. Numbers inside mutation boxes show variant frequency (VF), with dark and light green boxes indicating homozygous (>0.8 VF) and heterozygous/complex (<0.8 VF) mutations, respectively. Orange boxes indicate presence of mutation and corresponding VF for CTC pools, tissue WES, and cfDNA. Numbers inside CNA boxes show the log2 copy number ratio (CNR), with gains and losses shown in red and blue, respectively. CTC IDs are shown at the top of heat map with pooled sample IDs shaded. Note: tumor cont. = tumor content; for patient #24, “B” and “P” represent CTC samples at baseline and progression, respectively; *ddPCR droplets for this mutation were detected, but below the predetermined threshold.

