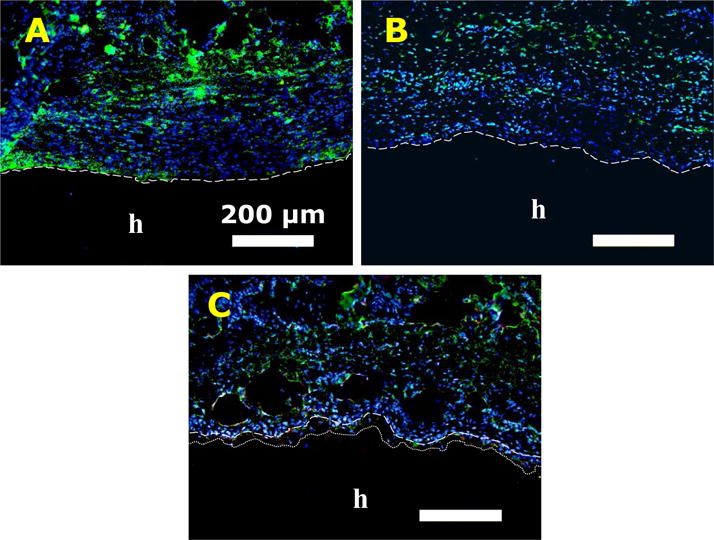
Figure 10.

Immunofluorescence staining of PEG-DA (A), PEG10%N (B), and PEG10%M (C) after 4 weeks of subcutaneous implantation. Letters h indicate the location of the adhesive. Dash lines indicate the tissue-adhesive interface. Dotted line in (C) indicates the depth of cellular infiltration. Blue (DAPI): cell nuclei; Green (CD68): macrophage; Red (CD163): M2 macrophage. Scale bars are 200 μm.
