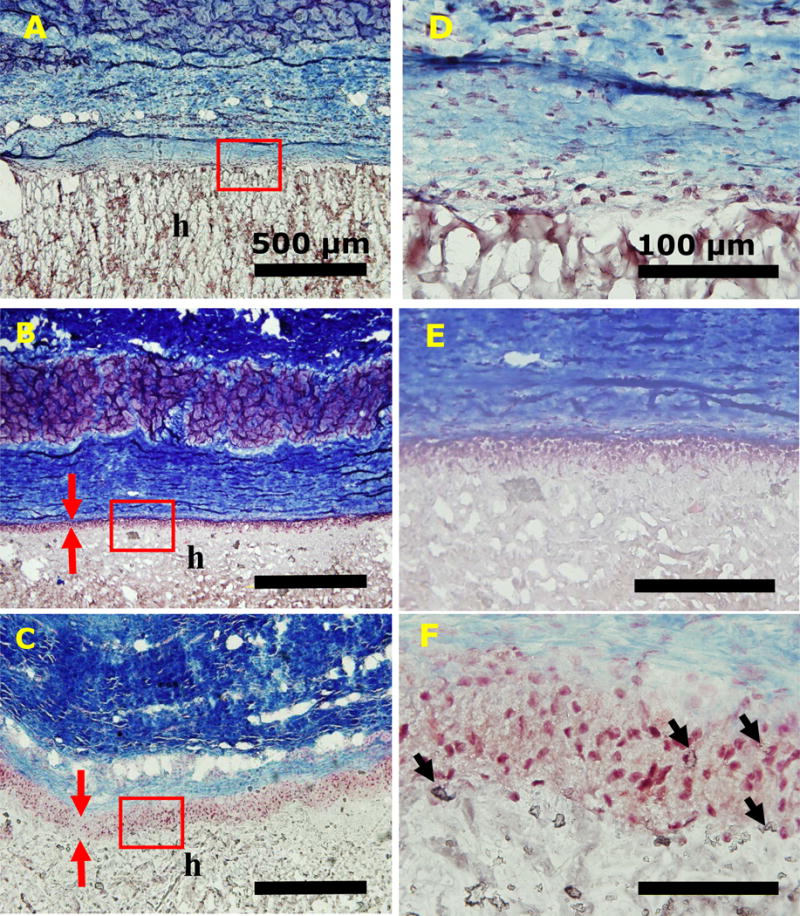
Figure 9.

Trichrome staining of PEG-DA (A, D), PEG10%N (B, E), and PEG10%M (C, F) and their surrounding tissue after 4-week subcutaneous implantation. Letters h indicate the location of the adhesive. Red arrows indicate the thickness of cellular infiltration layer. Black arrow indicates silica particle clusters. Scale bars are 500 μm (A, B, and C) and 100 μm (D, E, and F).
