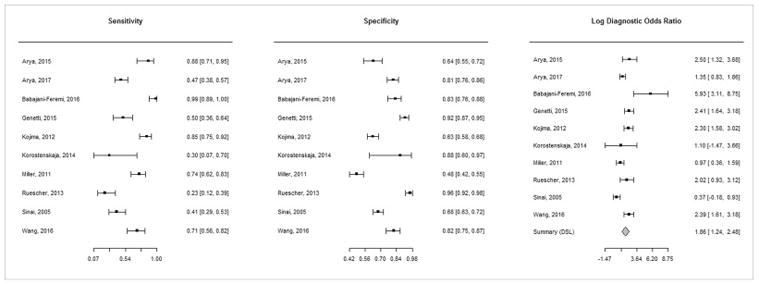
Figure 2.

Forest plots of sensitivity, specificity, and diagnostic odds ratio (DOR) showing study specific estimates with 95% confidence intervals for these metrics.
The estimates for DOR are on a logarithmic scale. Since the sensitivity/specificity pairs from all studies are correlated, separate pooled estimates are not calculated for them. Instead, a pooled estimate for DOR is obtained.
