
Figure 4.
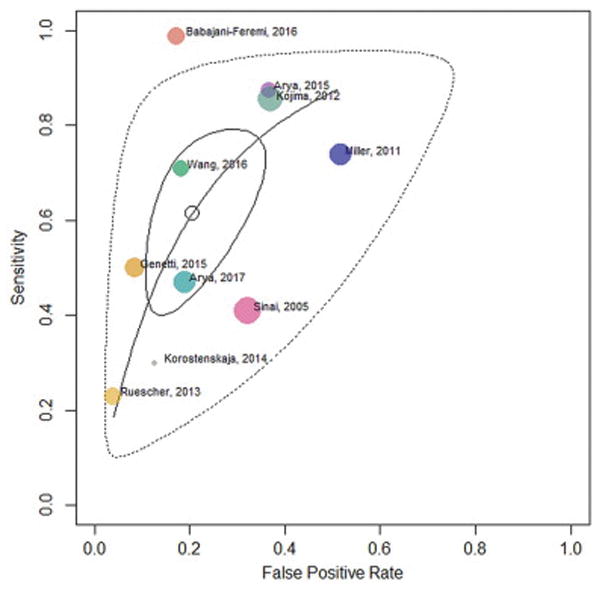
Summary Receiver Operating Characteristic (SROC) curve
SROC curve is shown with pooled estimate (open circle), 95% confidence region (solid closed curve), and 95% prediction region (dotted closed curve). This curve is obtained by modeling its slope in the logit space as the geometric mean of the slopes of the two regression lines, logit (sensitivity) on logit (false positive rate) and vice versa (Rutter-Gatsonis Hierarchical SROC). Study specific estimates (colored bubbles) are also shown. The size of the bubble is proportional to the total number or electrodes in the study.