
Figure 2. Peptide-resolution mapping of deuterium uptake reveals areas of Cascade that become more or less protected upon dsDNA binding.
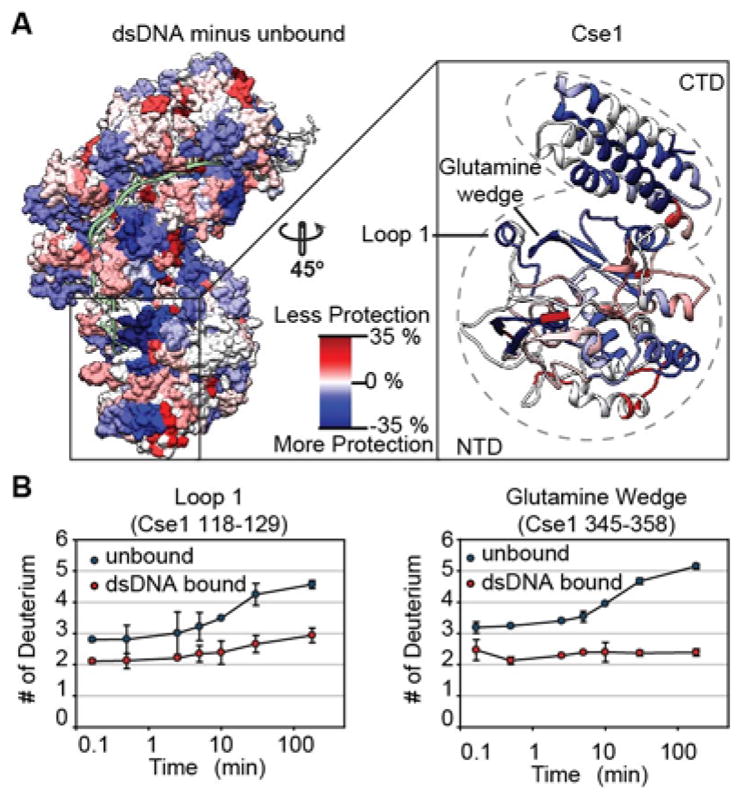
(A) The percentage difference in deuterium uptake between the unbound and dsDNA bound complex for individual peptides at the 180-minute time point was mapped onto the dsDNA bound structure (5H9F). Blue indicates less deuterium incorporation in the dsDNA bound form (protection) while the red indicates more deuterium incorporation in the dsDNA bound form (de-protection). White indicates regions where there is no difference in deuterium uptake or peptides where no data is available. The inset shows the ribbon structure of the Cse1 subunit with the glutamine wedge and Loop 1 showing increased protection. The Cse1 subunit consists of a four-helix bundle (CTD) and globular domain (NTD). (B) Deuterium uptake curves show increased protection in the dsDNA bound form for peptides in Loop 1 (p-value<0.01 for all time points) and the glutamine wedge (p-value<0.01 for all time points after 2.5 minutes). Error bars represent the standard deviation of three replicates.