
Figure 6.
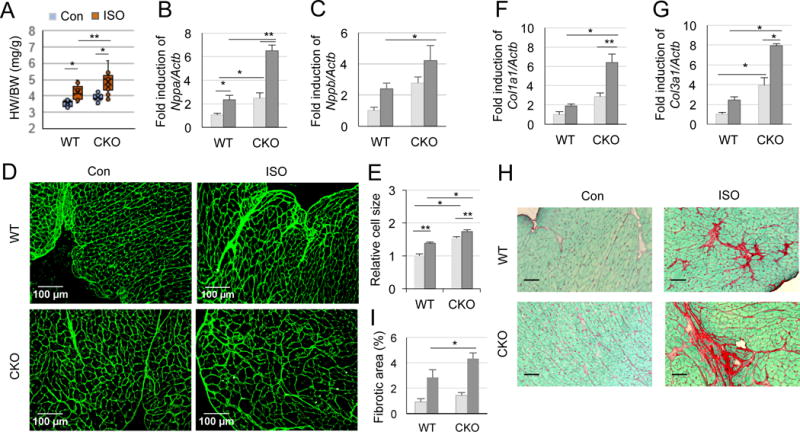
Increased chronic ISO-induced hypertrophy and fibrosis in CKO mice. WT and CKO mice were treated with 0.9% saline or ISO for 15 days (A-G) or for 35 days (H-I). A, Ratio of heart-to-body weight. *P<0.01 and **P<0.05 (two-way ANOVA, n=12-13). B-C, Relative expression of hypertrophic markers normalized to reference gene Actb: Nppa (B) and Nppb (C). *P<0.05 and **P<0.001 (two-way ANOVA, n=4-8). D, Representative microphotographs illustrate cross-sectional cardiomyocytes stained with WGA in WT and CKO mice. E, Summary of cell size from average 100 cells in 4 areas of a heart in D. *P<0.05 and **P<0.001 (two-way ANOVA, n=3-6). F-G, Relative expressions of Col1a1 (F) and Col3a1 (G) normalized to Actb. *P<0.001 and **P<0.01 (two-way ANOVA, n=3-8). H, Representative microphotographs of sirius red-fast green (SRFG) staining of hearts after ISO treatment for 5 weeks. Scale bar: 50 μm. I, Quantitation of fibrotic areas (red) from non-overlapping average 27 areas of each slide in H. *P<0.05 (two-way ANOVA, n=4-6).