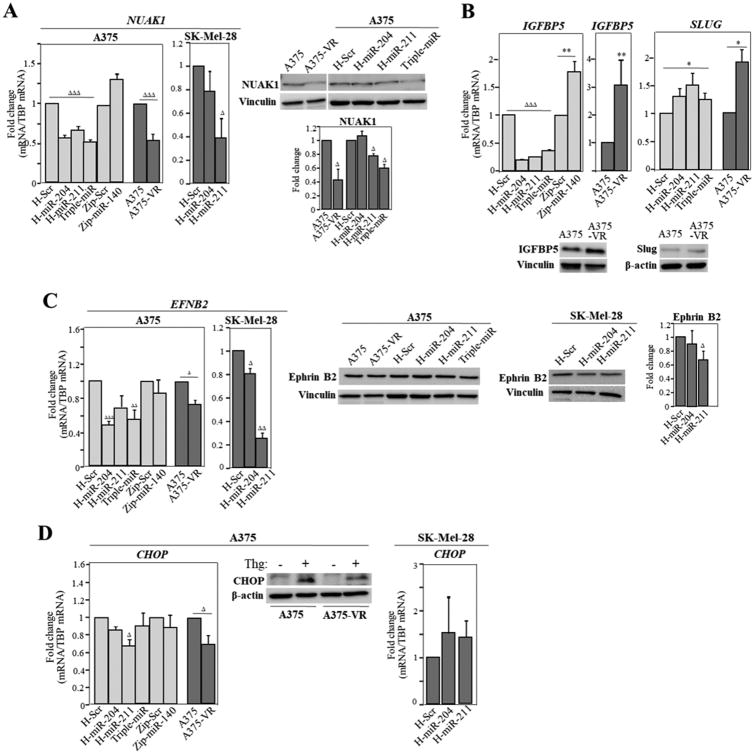
Figure 7. Analyses of miRNA target expression in cells overexpressing miR-204-5p and miR-211-5p and in A375-VR cells.
mRNA and protein levels for NUAK1 (A), IGFBP5 and Slug (B), Ephrin B2 (C) and CHOP were determined by qPCR or immunoblotting, respectively. Relative fold change values from the blots are also displayed. ΔΔΔExpression was significantly reduced, p<0.001, ΔΔp<0.01, Δp<0.05, or **stimulated, p<0.01, *p<0.05 (n=3-5).

