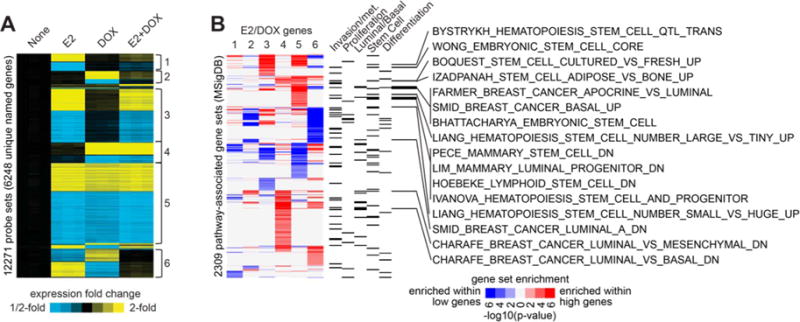
Figure 6. Global gene expression profiling reveals enrichment of invasive and metastatic, as well basal-like and stem-like, gene signatures following E2 treatment and activation of IKKβ.

A. MCF-7-CA-IKKβ cells were treated with E2, DOX, or E2+DOX for 72 hrs. mRNA was purified, and samples were analyzed on an Affymetrix high-density oligonucleotide array. Statistical analysis (using cutoffs of p<0.01 by t-test, False Discovery Rate (FDR)<0.05, and fold change>1.5 for any experimental group relative to control) followed by supervised clustering was performed. Six major patterns of gene regulation were observed (labeled next to the expression heat map as 1 through 6), involving 12271 gene probes (representing 6248 unique named genes) showing differential expression out of ~49K probes assessed. B, Each of the gene sets represented by the six major patterns from panel A were examined for enrichment of pathway-associated genes sets from the Molecular Signature Database (MSigDB). For each pattern, “high” genes were evaluated separately from “low” genes (for pattern 6, high and low represents high and low in the DOX group); results for high and low genes shown in red or blue, respectively. P-values were determined by one-sided Fisher’s exact test. MSigDB gene sets with a significance level of FDR<0.1 (involving at least ten genes) for any one E2/DOX gene patterns are represented here (associations with FDR>0.1 are neutral color). Categories of interest for the MSigDB gene sets are indicated (according to key words “invasion” or “metastasis”, “proliferation”, “basal” or “luminal”, “stem cell”, or “differentiation”). MSigDB gene sets that were associated with either basal/luminal or stem cells, as well as enriched within the genes up in pattern 5, are listed individually.
