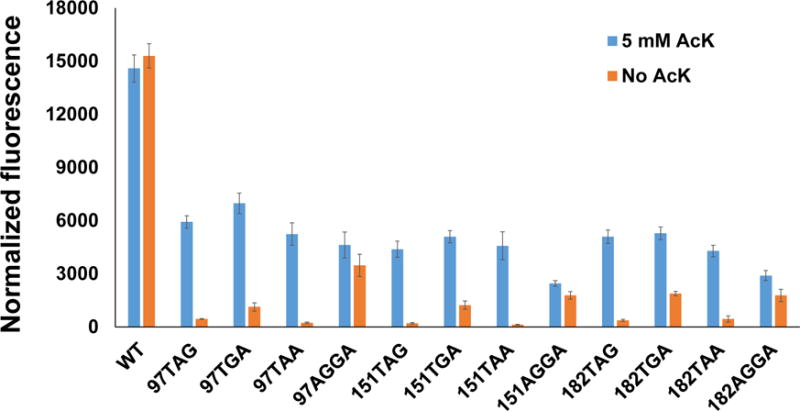
Figure 1. The sfGFP readthrough assay towards various codons at different positions.

Normalized fluorescence intensities were calculated from fluorescence readings at 12 h divided by absorbance at 600 nm. Mean values and standard deviations were calculated from three replicates.
