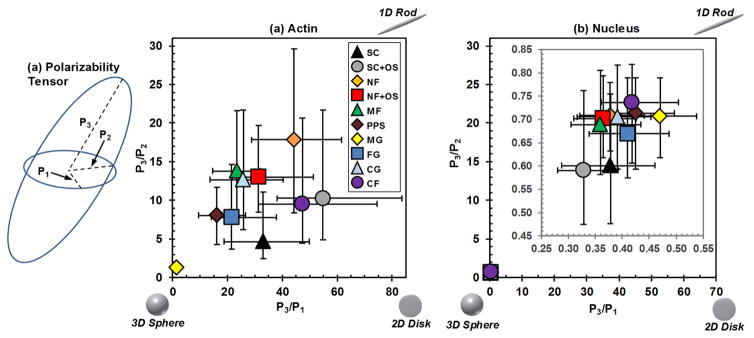
Fig. 5.
(a) The principal moments of the polarizability tensor yield a characteristic ellipsoid for each cell where P1 is the shortest semi-axis, P2 is the middle semi-axis and P3 is the longest semi-axis. (b,c) A polarizability “dimensionality” plot is constructed by plotting the ratios of the lengths of the semi-axes, where the upper right corner has more 1D-character (rod), bottom right corner has more 2D-character (disk) and bottom left corner has more 3D-character (sphere). Polarizability “dimensionality” plots are shown for (b) actin and (c) nucleus. (c) Inset: Since the nucleus data were tightly clustered, the inset provides an expanded view of the data. Data are median with first and third quartiles. Approximately 100 cells were imaged for each scaffold (see Table 1). Statistical analysis is in Fig. S2. There were many statistically significant differences in the data which have been omitted for clarity. A full statistical analysis is given in Fig. S2.

