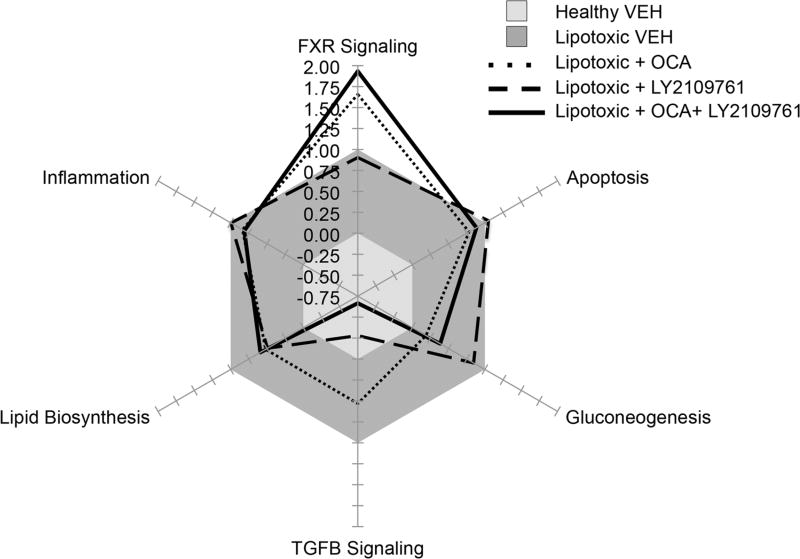
Fig. 4.
Lipotoxic in vitro model comparing obeticholic acid and a TGFβR inhibitor (LY2109761). The effect of obeticholic acid (OCA, dotted line) alone, a TGFβR inhibitor (LY2109761, dashed line) alone, or a combination of both treatments (solid line) were evaluated on key signaling pathways associated with NASH in the Feaver et al. lipotoxic in vitro model [23]. The axes represent the average gene pathway fold change response relative to the lipotoxic vehicle (VEH) response (gray, set to equal 1) and a healthy control response (light gray, set to equal 0)

