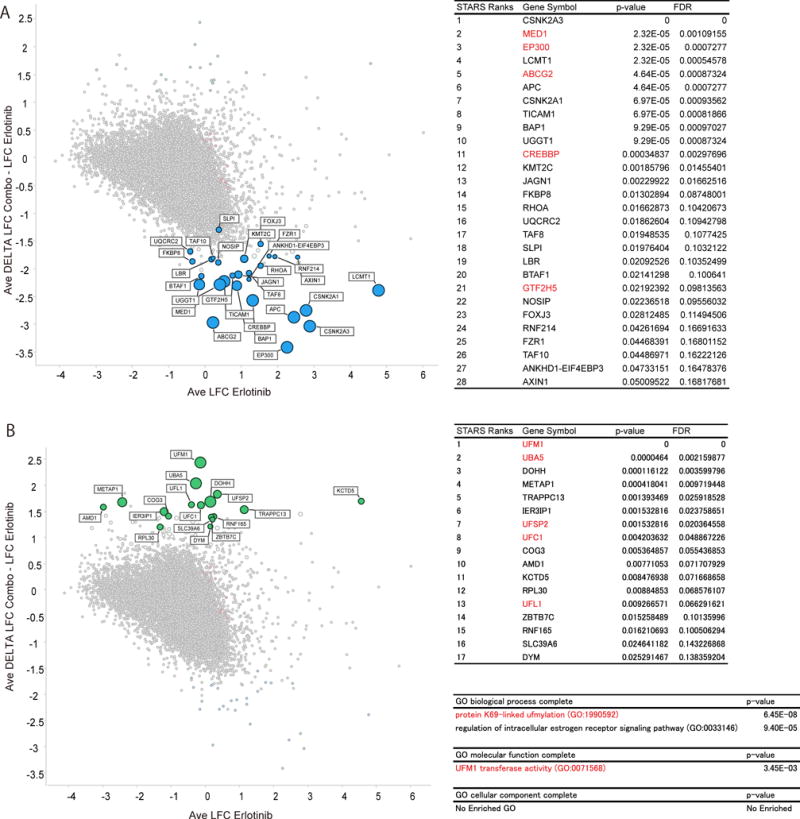
Figure 2. Identified synergy enhancers and synergy suppressors.

Genome wide CRISPR screen dissects synergistic effect of THZ1. A), B) Scatter plots for synergy enhancer genes (A) or synergy suppressor genes (B). Horizontal axis indicates average log 2 fold change (LFC) from early time point sample after erlotinib treatment. Vertical axis indicates delta log 2 fold change between erlotinib treatment and combination treatment. Tables indicate the most enriched (FDR <0.25) genes ranked by STARS algorithm for synergy enhancer genes (A) or synergy suppressor genes (B). GO analysis was performed with the enriched synergy suppressor genes (B).
