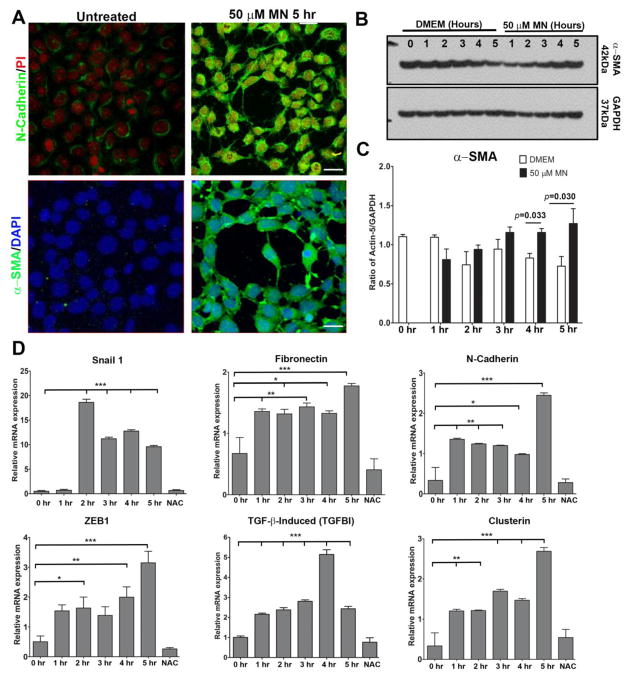
Figure 4.
EMT and FECD marker expression after 50μM MN exposure in HCEnCs. A. Immunofluorescent labelling, observed with confocal microscopy, reveals N-cadherin and α-SMA protein expression increases following 5 hours pre-treatment with 50μM MN compared to untreated controls. Nuclei were counterstained with propidium iodide (PI) or DAPI. B, C. Quantification of Western blot α-SMA levels in HCEnCs after 1–5 hours 50μM MN exposure reveals a significant increase at 4 and 5 hours compared to untreated controls. Statistical significance tested using a Student’s t-test. D. Changes in EMT and FECD marker mRNA levels in response to MN treatment assessed over a 5-hour period using RT-PCR, with a supplement of NAC added at the 5-hour time point. Relative mRNA expression was normalized to GAPDH. One-way ANOVA followed by Dunnett’s post-hoc test was used to assess statistical significance, with all data time points compared to the 0-hour control. Bar graphs represent mean values ± SE (n=6). Scale bars = 50μm.

