Figure 7.
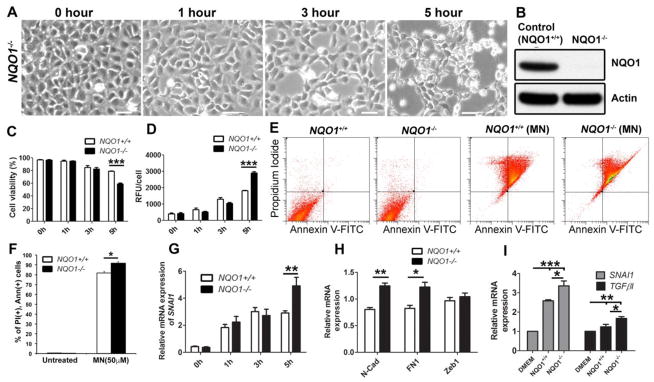
Loss of NQO1 potentiates 50μM MN-induced EMT. A. NQO1−/− cells observed with phase-contrast microscopy following 1–5 hours MN treatment. Untreated (0 hour) NQO1−/− cells were used as a control. B. Representative Western blot showing knock-down of NQO1 protein. C. Cell viability (D) and intracellular ROS comparison between MN treated NQO1−/− and control cells assessed. E. Control and NQO1−/− cells were pretreated with 50μM MN for 5 hours and stained with Annexin-V (Ann) and propidium iodide (PI). Representative images of flow cytometry analysis gated for vital (Ann-/PI-), early apoptotic (Ann+/PI-), late apoptotic (Ann+/PI+), and necrotic (Ann-/PI+) cell populations in control and NQO1−/−cells are shown. F. The percentage of late apoptotic cells (PI+ and Ann+). G. Snail1 relative mRNA expression changes over 1–5 hours MN exposure in NQO1−/− and controls cells. H. Relative changes in N-cadherin, fibronectin, and ZEB1 mRNA expression after 5 hours MN treatment. I. Cells were pre-starved in serum-free media before 24 hours TGF-β1 exposure. Snail 1 and TGFβI mRNA levels were assessed in NQO1−/− and control cells. Student’s t-test or one-way ANOVA with Tukey’s post-hoc test was performed to identify the statistical significance (*p < 0.05, **p < 0.01, ***p < 0.001). All RT-PCR data is expressed as fold change and normalized to GAPDH. Bar graphs represent mean values ± SE (n=6). Scale bars = 100μm.

