
Figure 1.
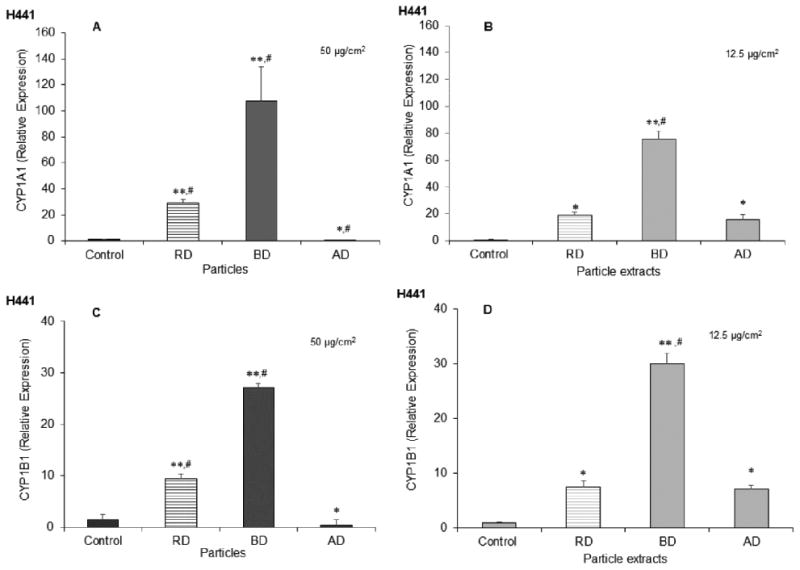
CYP1A1 and CYP1B1 mRNA expression due to treatment with particles and particle extracts. Human H441 cells were exposed to cdPM (A and C) and cdPM extracts (B and D) or medium alone for 24h. Treatments were = 50 μg/cm2 (200 μg/mL) for particles and 12.5 μg/cm2 (50 μg/mL) for particle extracts. Control = medium + DMSO (0.1% v/v). Data are expressed as mean ± SEM (n=3) and are representative of 3 independent experiments. *Indicates statistical significance (*p<0.05; **p<0.005) relative to the control (one-way ANOVA). #Indicates difference (p<0.05) relative to other marked groups (one-way ANOVA with Tukey's HSD). Solid columns indicate cdPM from the FFB, and hatched columns indicate reference diesel.