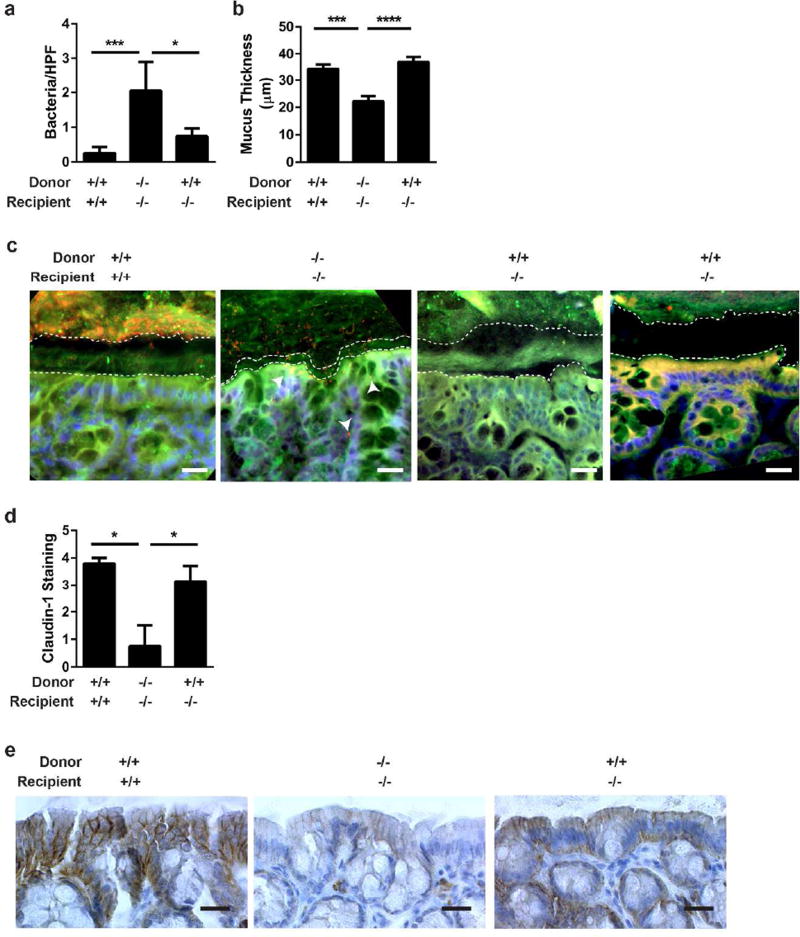
Figure 6. Transfer of IL-6+ IELs into IL-6 −/− mice restores the mucus layer and claudin-1 expression.
(a) FISH was performed on tissues from Figure 5 and the number of bacteria located within intestinal tissue in each of 20 HPF (at 400X) were counted and shown at the mean bacteria/HPF ± SEM. *, P<0.05; ***,P<0.001 by Kruskall-Wallis test with Dunn’s multiple comparisons test. (b) Mucus thickness in 3 areas of each of 4 HPF per mouse was measured in sections from (a) and displayed as the mean mucus thickness ± SEM. Statistical significance was determined by one-way ANOVA with Tukey’s post-test. ***,P<0.001; ****P<0.0001 (c) Representative FISH is shown at 400X. Bar=20 µm. A universal bacterial probe (red) was used to mark bacteria; nuclei were labeled with bis-benzimide (blue); and the mucus layer labeled with wheat germ agglutinin (green). Dashed white lines outline the epithelial and luminal borders of the inner mucus layer. Arrowheads point to areas of bacterial translocation. (d) Claudin-1 protein expression from the experiment in Figure 5 was evaluated by immunohistochemistry and assessed a numeric score for each mouse based on the level of staining: 0=no staining, 1=faint, 2=mild; 3=moderate; 4=intense. The mean staining intensity per group ± SEM is shown and statistical significance was assessed using a Kruskall-Wallis test with Dunn’s multiple comparisons test. *,P<0.05 (e) Representative claudin-1 immunohistochemistry (brown) is shown at 400X. Bar=20 µm.

