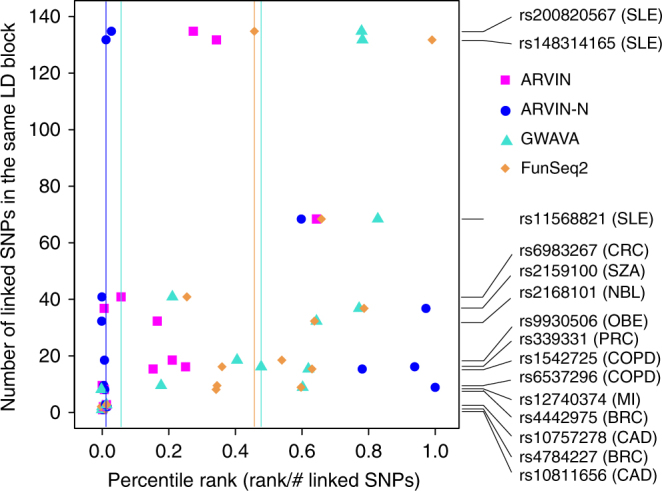
Fig. 3.

Performance benchmarking using known risk SNPs located in enhancers. References for validated risk enhancer SNPs are provided in Supplementary Table 4. Y-axis represents the number of linked eSNPs in the same LD block as the known risk SNP(s). Performance is expressed as percentile ranking on the x-axis in which each gold-standard risk SNP was ranked against all other SNPs in the same linkage equilibrium block as the gold-standard SNP. Filled symbols, rank of an individual gold-standard SNP by a given method. Vertical lines, median rank of the full set of gold-standard SNPs by a given method. SNP IDs and associated diseases are shown on the right. SLE, systemic lupus erythematosus; PSO, psoriasis; CRC, colorectal cancer; PRC, prostate cancer; RA, rheumatoid arthritis; OBE, obesity; MI, myocardial infarction; BRC, breast cancer; COPD, chronic obstructive pulmonary disease; SZA, schizophrenia; CAD, coronary artery disease; NBL, neuroblastoma
