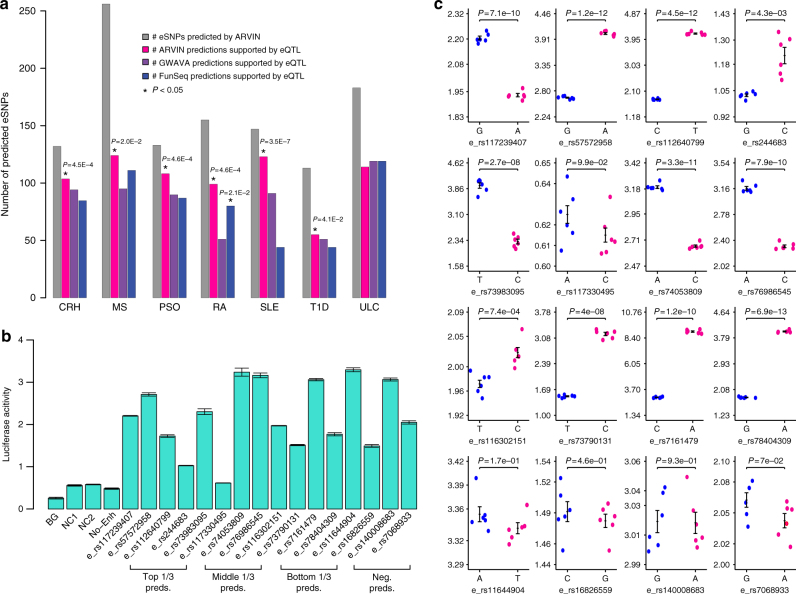
Fig. 4.
Predicted risk enhancer SNPs in seven autoimmune diseases. a Number of predicted risk eSNPs in each disease and overlap with eQTL data. For comparison purpose, the prediction thresholds of GWAVA and FunSeq2 were set to give the same number of predictions as ARVIN. Statistical significance of overlap between predicted eSNPs by a given method and eQTL data were computed using the hypergeometric distribution. *P value < 0.05. CRH, Crohn’s disease; MS, multiple sclerosis; PSO, psoriasis; RA, rheumatoid arthritis; SLE, systemic lupus erythematosus; T1D, type 1 diabetes; ULC, ulcerative colitis. b Luciferase reporter assay of enhancers containing predicted risk eSNPs and negative control eSNPs. Reporter activity is relative to co-transfected Renilla control. BG, no DNA; NC1 & NC2, negative controls, genomic region without H3K4me1 and H3K27ac signals; No-Enh, construct containing only heat-shock (HS) promoter but no enhancer sequence; Top 1/3 pred., eSNPs in the top 1/3 of predictions by ARVIN, etc. Neg. pred., negative predictions by ARVIN. Values shown are means ± s.e.m. of six replicates. c Luciferase reporter activity for both alleles of 12 predicted risk eSNPs (top three rows) and 4 negative control (bottom row) eSNPs. Values shown are means ± s.e.m. of six replicates. P values are calculated using two-tailed t test

